Yup'ik vs Immigrants from Zimbabwe Single Mother Households
COMPARE
Yup'ik
Immigrants from Zimbabwe
Single Mother Households
Single Mother Households Comparison
Yup'ik
Immigrants from Zimbabwe
10.0%
SINGLE MOTHER HOUSEHOLDS
0.0/ 100
METRIC RATING
347th/ 347
METRIC RANK
6.2%
SINGLE MOTHER HOUSEHOLDS
69.9/ 100
METRIC RATING
162nd/ 347
METRIC RANK
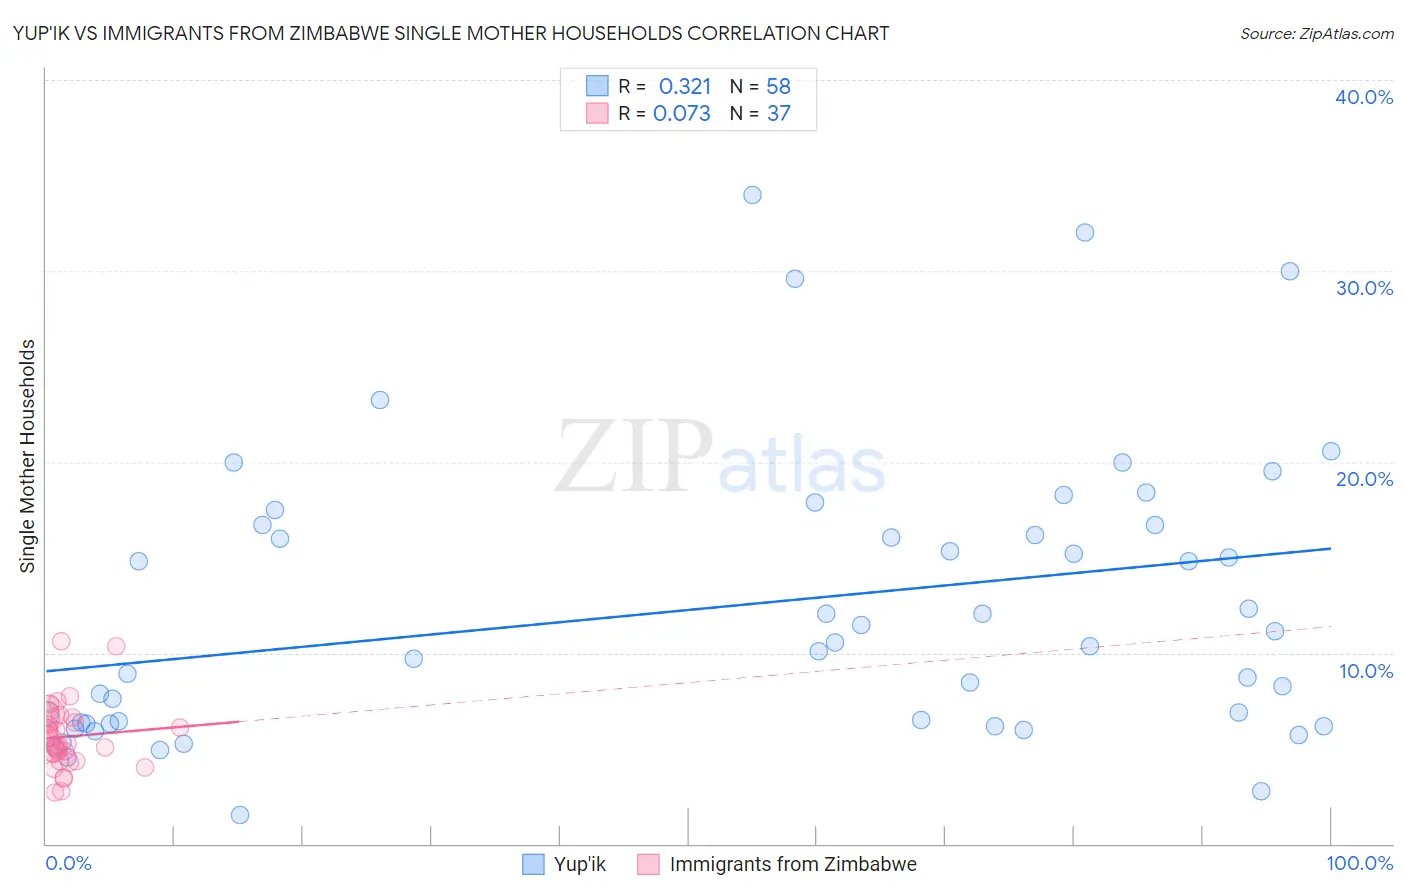
Yup'ik vs Immigrants from Zimbabwe Single Mother Households Correlation Chart
The statistical analysis conducted on geographies consisting of 39,868,433 people shows a mild positive correlation between the proportion of Yup'ik and percentage of single mother households in the United States with a correlation coefficient (R) of 0.321 and weighted average of 10.0%. Similarly, the statistical analysis conducted on geographies consisting of 117,740,181 people shows a slight positive correlation between the proportion of Immigrants from Zimbabwe and percentage of single mother households in the United States with a correlation coefficient (R) of 0.073 and weighted average of 6.2%, a difference of 62.2%.
Single Mother Households Correlation Summary
| Measurement | Yup'ik | Immigrants from Zimbabwe |
| Minimum | 1.5% | 2.7% |
| Maximum | 34.0% | 10.6% |
| Range | 32.5% | 7.9% |
| Mean | 12.4% | 5.6% |
| Median | 10.4% | 5.2% |
| Interquartile 25% (IQ1) | 6.3% | 4.5% |
| Interquartile 75% (IQ3) | 16.7% | 6.6% |
| Interquartile Range (IQR) | 10.4% | 2.1% |
| Standard Deviation (Sample) | 7.4% | 1.7% |
| Standard Deviation (Population) | 7.4% | 1.7% |
Similar Demographics by Single Mother Households
Demographics Similar to Yup'ik by Single Mother Households
In terms of single mother households, the demographic groups most similar to Yup'ik are Yuman (9.6%, a difference of 3.8%), Immigrants from Cabo Verde (9.6%, a difference of 4.4%), Immigrants from Dominican Republic (9.5%, a difference of 5.2%), Dominican (9.2%, a difference of 8.9%), and Menominee (9.2%, a difference of 9.2%).
| Demographics | Rating | Rank | Single Mother Households |
| Liberians | 0.0 /100 | #333 | Tragic 8.6% |
| Immigrants | Liberia | 0.0 /100 | #334 | Tragic 8.7% |
| Immigrants | Dominica | 0.0 /100 | #335 | Tragic 8.7% |
| Puerto Ricans | 0.0 /100 | #336 | Tragic 8.7% |
| Navajo | 0.0 /100 | #337 | Tragic 8.8% |
| Cape Verdeans | 0.0 /100 | #338 | Tragic 8.9% |
| Blacks/African Americans | 0.0 /100 | #339 | Tragic 9.0% |
| Lumbee | 0.0 /100 | #340 | Tragic 9.1% |
| Tohono O'odham | 0.0 /100 | #341 | Tragic 9.1% |
| Menominee | 0.0 /100 | #342 | Tragic 9.2% |
| Dominicans | 0.0 /100 | #343 | Tragic 9.2% |
| Immigrants | Dominican Republic | 0.0 /100 | #344 | Tragic 9.5% |
| Immigrants | Cabo Verde | 0.0 /100 | #345 | Tragic 9.6% |
| Yuman | 0.0 /100 | #346 | Tragic 9.6% |
| Yup'ik | 0.0 /100 | #347 | Tragic 10.0% |
Demographics Similar to Immigrants from Zimbabwe by Single Mother Households
In terms of single mother households, the demographic groups most similar to Immigrants from Zimbabwe are Alsatian (6.2%, a difference of 0.16%), Immigrants from Northern Africa (6.2%, a difference of 0.25%), Immigrants from Syria (6.2%, a difference of 0.32%), Immigrants from Germany (6.1%, a difference of 0.34%), and Iraqi (6.1%, a difference of 0.42%).
| Demographics | Rating | Rank | Single Mother Households |
| Whites/Caucasians | 76.5 /100 | #155 | Good 6.1% |
| Native Hawaiians | 75.0 /100 | #156 | Good 6.1% |
| Chileans | 74.2 /100 | #157 | Good 6.1% |
| Celtics | 73.3 /100 | #158 | Good 6.1% |
| Yugoslavians | 73.1 /100 | #159 | Good 6.1% |
| Iraqis | 73.0 /100 | #160 | Good 6.1% |
| Immigrants | Germany | 72.4 /100 | #161 | Good 6.1% |
| Immigrants | Zimbabwe | 69.9 /100 | #162 | Good 6.2% |
| Alsatians | 68.7 /100 | #163 | Good 6.2% |
| Immigrants | Northern Africa | 68.0 /100 | #164 | Good 6.2% |
| Immigrants | Syria | 67.4 /100 | #165 | Good 6.2% |
| Sri Lankans | 63.9 /100 | #166 | Good 6.2% |
| Brazilians | 59.1 /100 | #167 | Average 6.2% |
| Immigrants | Chile | 58.3 /100 | #168 | Average 6.3% |
| Puget Sound Salish | 58.1 /100 | #169 | Average 6.3% |