Yup'ik vs Immigrants from Pakistan Single Mother Households
COMPARE
Yup'ik
Immigrants from Pakistan
Single Mother Households
Single Mother Households Comparison
Yup'ik
Immigrants from Pakistan
10.0%
SINGLE MOTHER HOUSEHOLDS
0.0/ 100
METRIC RATING
347th/ 347
METRIC RANK
6.0%
SINGLE MOTHER HOUSEHOLDS
88.4/ 100
METRIC RATING
137th/ 347
METRIC RANK
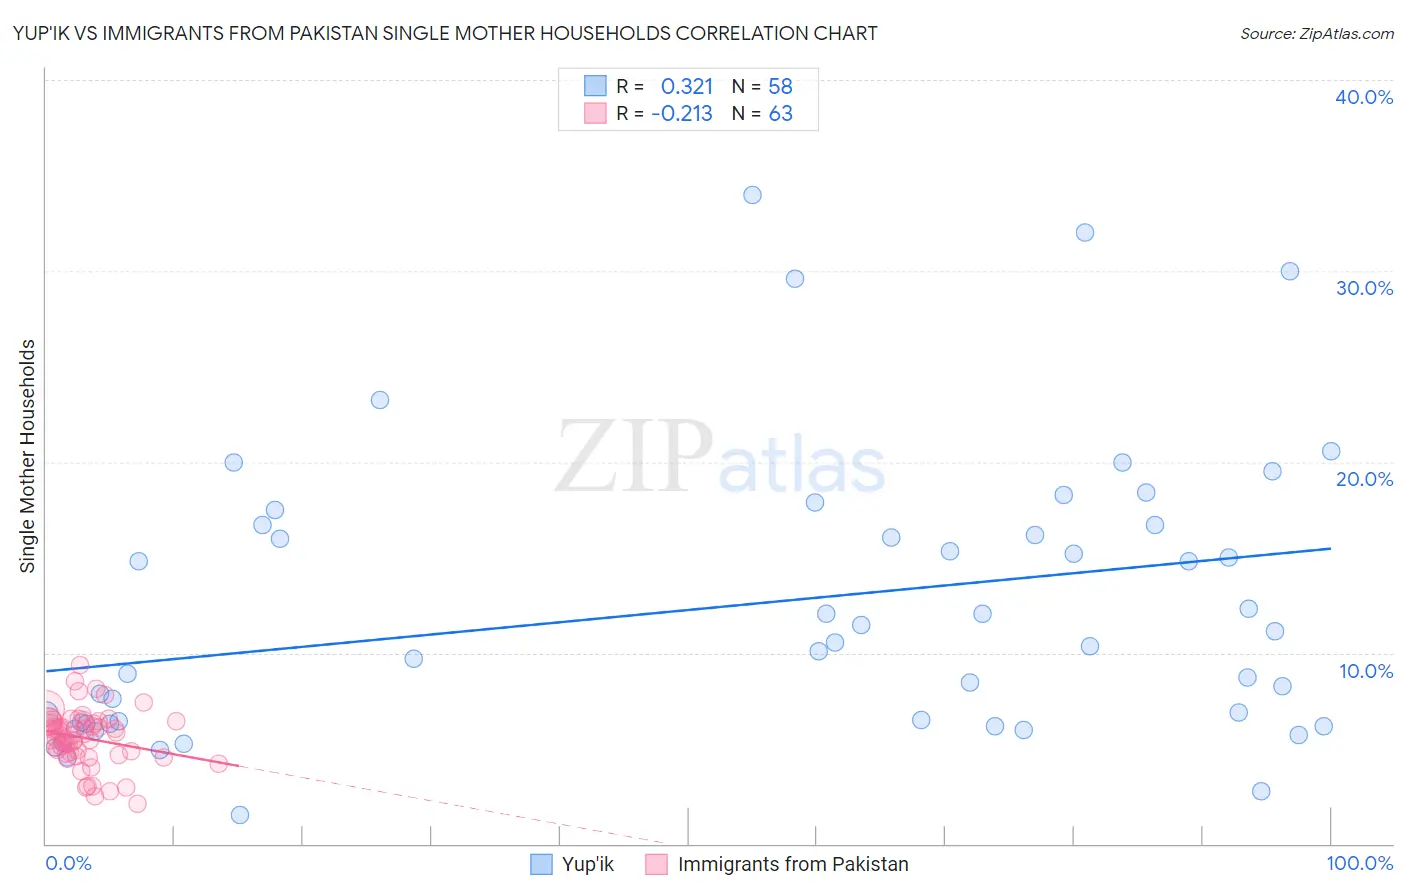
Yup'ik vs Immigrants from Pakistan Single Mother Households Correlation Chart
The statistical analysis conducted on geographies consisting of 39,868,433 people shows a mild positive correlation between the proportion of Yup'ik and percentage of single mother households in the United States with a correlation coefficient (R) of 0.321 and weighted average of 10.0%. Similarly, the statistical analysis conducted on geographies consisting of 283,504,860 people shows a weak negative correlation between the proportion of Immigrants from Pakistan and percentage of single mother households in the United States with a correlation coefficient (R) of -0.213 and weighted average of 6.0%, a difference of 67.8%.
Single Mother Households Correlation Summary
| Measurement | Yup'ik | Immigrants from Pakistan |
| Minimum | 1.5% | 2.1% |
| Maximum | 34.0% | 9.4% |
| Range | 32.5% | 7.3% |
| Mean | 12.4% | 5.5% |
| Median | 10.4% | 5.7% |
| Interquartile 25% (IQ1) | 6.3% | 4.7% |
| Interquartile 75% (IQ3) | 16.7% | 6.4% |
| Interquartile Range (IQR) | 10.4% | 1.7% |
| Standard Deviation (Sample) | 7.4% | 1.5% |
| Standard Deviation (Population) | 7.4% | 1.4% |
Similar Demographics by Single Mother Households
Demographics Similar to Yup'ik by Single Mother Households
In terms of single mother households, the demographic groups most similar to Yup'ik are Yuman (9.6%, a difference of 3.8%), Immigrants from Cabo Verde (9.6%, a difference of 4.4%), Immigrants from Dominican Republic (9.5%, a difference of 5.2%), Dominican (9.2%, a difference of 8.9%), and Menominee (9.2%, a difference of 9.2%).
| Demographics | Rating | Rank | Single Mother Households |
| Liberians | 0.0 /100 | #333 | Tragic 8.6% |
| Immigrants | Liberia | 0.0 /100 | #334 | Tragic 8.7% |
| Immigrants | Dominica | 0.0 /100 | #335 | Tragic 8.7% |
| Puerto Ricans | 0.0 /100 | #336 | Tragic 8.7% |
| Navajo | 0.0 /100 | #337 | Tragic 8.8% |
| Cape Verdeans | 0.0 /100 | #338 | Tragic 8.9% |
| Blacks/African Americans | 0.0 /100 | #339 | Tragic 9.0% |
| Lumbee | 0.0 /100 | #340 | Tragic 9.1% |
| Tohono O'odham | 0.0 /100 | #341 | Tragic 9.1% |
| Menominee | 0.0 /100 | #342 | Tragic 9.2% |
| Dominicans | 0.0 /100 | #343 | Tragic 9.2% |
| Immigrants | Dominican Republic | 0.0 /100 | #344 | Tragic 9.5% |
| Immigrants | Cabo Verde | 0.0 /100 | #345 | Tragic 9.6% |
| Yuman | 0.0 /100 | #346 | Tragic 9.6% |
| Yup'ik | 0.0 /100 | #347 | Tragic 10.0% |
Demographics Similar to Immigrants from Pakistan by Single Mother Households
In terms of single mother households, the demographic groups most similar to Immigrants from Pakistan are Jordanian (6.0%, a difference of 0.13%), Icelander (6.0%, a difference of 0.41%), Immigrants from Saudi Arabia (5.9%, a difference of 0.55%), Canadian (5.9%, a difference of 0.64%), and Syrian (6.0%, a difference of 0.64%).
| Demographics | Rating | Rank | Single Mother Households |
| Palestinians | 92.1 /100 | #130 | Exceptional 5.9% |
| Immigrants | Spain | 91.2 /100 | #131 | Exceptional 5.9% |
| Albanians | 91.1 /100 | #132 | Exceptional 5.9% |
| Egyptians | 90.7 /100 | #133 | Exceptional 5.9% |
| Canadians | 90.5 /100 | #134 | Exceptional 5.9% |
| Immigrants | Saudi Arabia | 90.2 /100 | #135 | Exceptional 5.9% |
| Jordanians | 88.9 /100 | #136 | Excellent 6.0% |
| Immigrants | Pakistan | 88.4 /100 | #137 | Excellent 6.0% |
| Icelanders | 86.9 /100 | #138 | Excellent 6.0% |
| Syrians | 86.0 /100 | #139 | Excellent 6.0% |
| French | 85.7 /100 | #140 | Excellent 6.0% |
| Tsimshian | 85.2 /100 | #141 | Excellent 6.0% |
| Immigrants | Egypt | 85.0 /100 | #142 | Excellent 6.0% |
| Immigrants | Iraq | 84.8 /100 | #143 | Excellent 6.0% |
| Koreans | 84.4 /100 | #144 | Excellent 6.0% |