Honduran vs Immigrants from Zimbabwe Single Mother Households
COMPARE
Honduran
Immigrants from Zimbabwe
Single Mother Households
Single Mother Households Comparison
Hondurans
Immigrants from Zimbabwe
8.1%
SINGLE MOTHER HOUSEHOLDS
0.0/ 100
METRIC RATING
310th/ 347
METRIC RANK
6.2%
SINGLE MOTHER HOUSEHOLDS
69.9/ 100
METRIC RATING
162nd/ 347
METRIC RANK
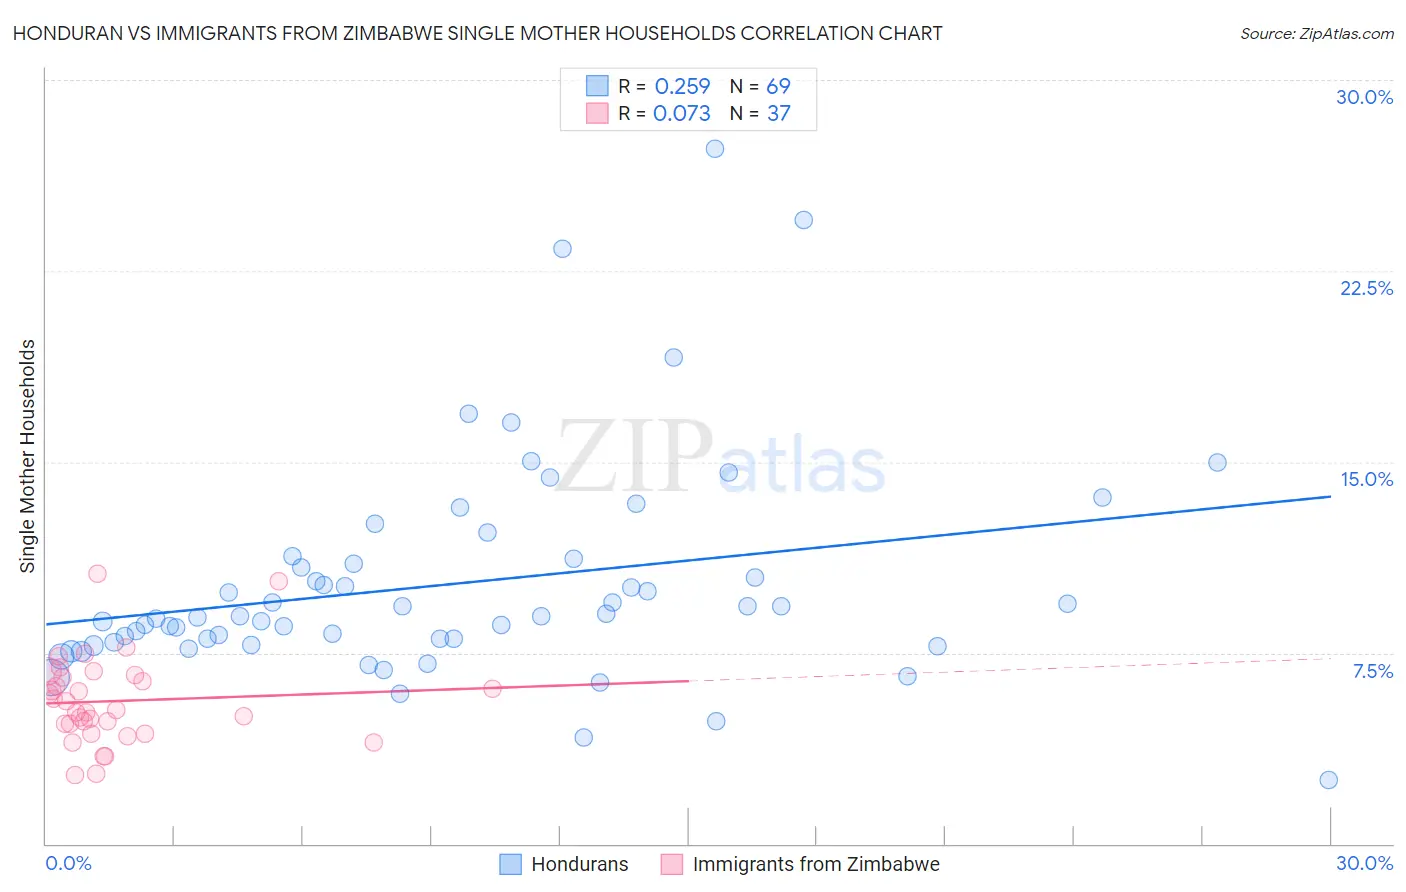
Honduran vs Immigrants from Zimbabwe Single Mother Households Correlation Chart
The statistical analysis conducted on geographies consisting of 357,144,636 people shows a weak positive correlation between the proportion of Hondurans and percentage of single mother households in the United States with a correlation coefficient (R) of 0.259 and weighted average of 8.1%. Similarly, the statistical analysis conducted on geographies consisting of 117,740,181 people shows a slight positive correlation between the proportion of Immigrants from Zimbabwe and percentage of single mother households in the United States with a correlation coefficient (R) of 0.073 and weighted average of 6.2%, a difference of 31.2%.
Single Mother Households Correlation Summary
| Measurement | Honduran | Immigrants from Zimbabwe |
| Minimum | 2.5% | 2.7% |
| Maximum | 27.3% | 10.6% |
| Range | 24.8% | 7.9% |
| Mean | 10.2% | 5.6% |
| Median | 8.9% | 5.2% |
| Interquartile 25% (IQ1) | 7.9% | 4.5% |
| Interquartile 75% (IQ3) | 11.1% | 6.6% |
| Interquartile Range (IQR) | 3.2% | 2.1% |
| Standard Deviation (Sample) | 4.4% | 1.7% |
| Standard Deviation (Population) | 4.3% | 1.7% |
Similar Demographics by Single Mother Households
Demographics Similar to Hondurans by Single Mother Households
In terms of single mother households, the demographic groups most similar to Hondurans are Cheyenne (8.1%, a difference of 0.050%), Immigrants from Congo (8.1%, a difference of 0.29%), Immigrants from Central America (8.1%, a difference of 0.50%), Immigrants from St. Vincent and the Grenadines (8.0%, a difference of 0.51%), and Bangladeshi (8.1%, a difference of 0.59%).
| Demographics | Rating | Rank | Single Mother Households |
| Immigrants | Bahamas | 0.0 /100 | #303 | Tragic 8.0% |
| Natives/Alaskans | 0.0 /100 | #304 | Tragic 8.0% |
| Colville | 0.0 /100 | #305 | Tragic 8.0% |
| Immigrants | Barbados | 0.0 /100 | #306 | Tragic 8.0% |
| Immigrants | St. Vincent and the Grenadines | 0.0 /100 | #307 | Tragic 8.0% |
| Immigrants | Central America | 0.0 /100 | #308 | Tragic 8.1% |
| Cheyenne | 0.0 /100 | #309 | Tragic 8.1% |
| Hondurans | 0.0 /100 | #310 | Tragic 8.1% |
| Immigrants | Congo | 0.0 /100 | #311 | Tragic 8.1% |
| Bangladeshis | 0.0 /100 | #312 | Tragic 8.1% |
| Immigrants | Grenada | 0.0 /100 | #313 | Tragic 8.2% |
| Immigrants | Mexico | 0.0 /100 | #314 | Tragic 8.2% |
| Immigrants | Western Africa | 0.0 /100 | #315 | Tragic 8.2% |
| Africans | 0.0 /100 | #316 | Tragic 8.2% |
| Immigrants | Honduras | 0.0 /100 | #317 | Tragic 8.2% |
Demographics Similar to Immigrants from Zimbabwe by Single Mother Households
In terms of single mother households, the demographic groups most similar to Immigrants from Zimbabwe are Alsatian (6.2%, a difference of 0.16%), Immigrants from Northern Africa (6.2%, a difference of 0.25%), Immigrants from Syria (6.2%, a difference of 0.32%), Immigrants from Germany (6.1%, a difference of 0.34%), and Iraqi (6.1%, a difference of 0.42%).
| Demographics | Rating | Rank | Single Mother Households |
| Whites/Caucasians | 76.5 /100 | #155 | Good 6.1% |
| Native Hawaiians | 75.0 /100 | #156 | Good 6.1% |
| Chileans | 74.2 /100 | #157 | Good 6.1% |
| Celtics | 73.3 /100 | #158 | Good 6.1% |
| Yugoslavians | 73.1 /100 | #159 | Good 6.1% |
| Iraqis | 73.0 /100 | #160 | Good 6.1% |
| Immigrants | Germany | 72.4 /100 | #161 | Good 6.1% |
| Immigrants | Zimbabwe | 69.9 /100 | #162 | Good 6.2% |
| Alsatians | 68.7 /100 | #163 | Good 6.2% |
| Immigrants | Northern Africa | 68.0 /100 | #164 | Good 6.2% |
| Immigrants | Syria | 67.4 /100 | #165 | Good 6.2% |
| Sri Lankans | 63.9 /100 | #166 | Good 6.2% |
| Brazilians | 59.1 /100 | #167 | Average 6.2% |
| Immigrants | Chile | 58.3 /100 | #168 | Average 6.3% |
| Puget Sound Salish | 58.1 /100 | #169 | Average 6.3% |