Immigrants from Indonesia vs Immigrants from Zimbabwe Single Mother Households
COMPARE
Immigrants from Indonesia
Immigrants from Zimbabwe
Single Mother Households
Single Mother Households Comparison
Immigrants from Indonesia
Immigrants from Zimbabwe
5.7%
SINGLE MOTHER HOUSEHOLDS
97.2/ 100
METRIC RATING
90th/ 347
METRIC RANK
6.2%
SINGLE MOTHER HOUSEHOLDS
69.9/ 100
METRIC RATING
162nd/ 347
METRIC RANK
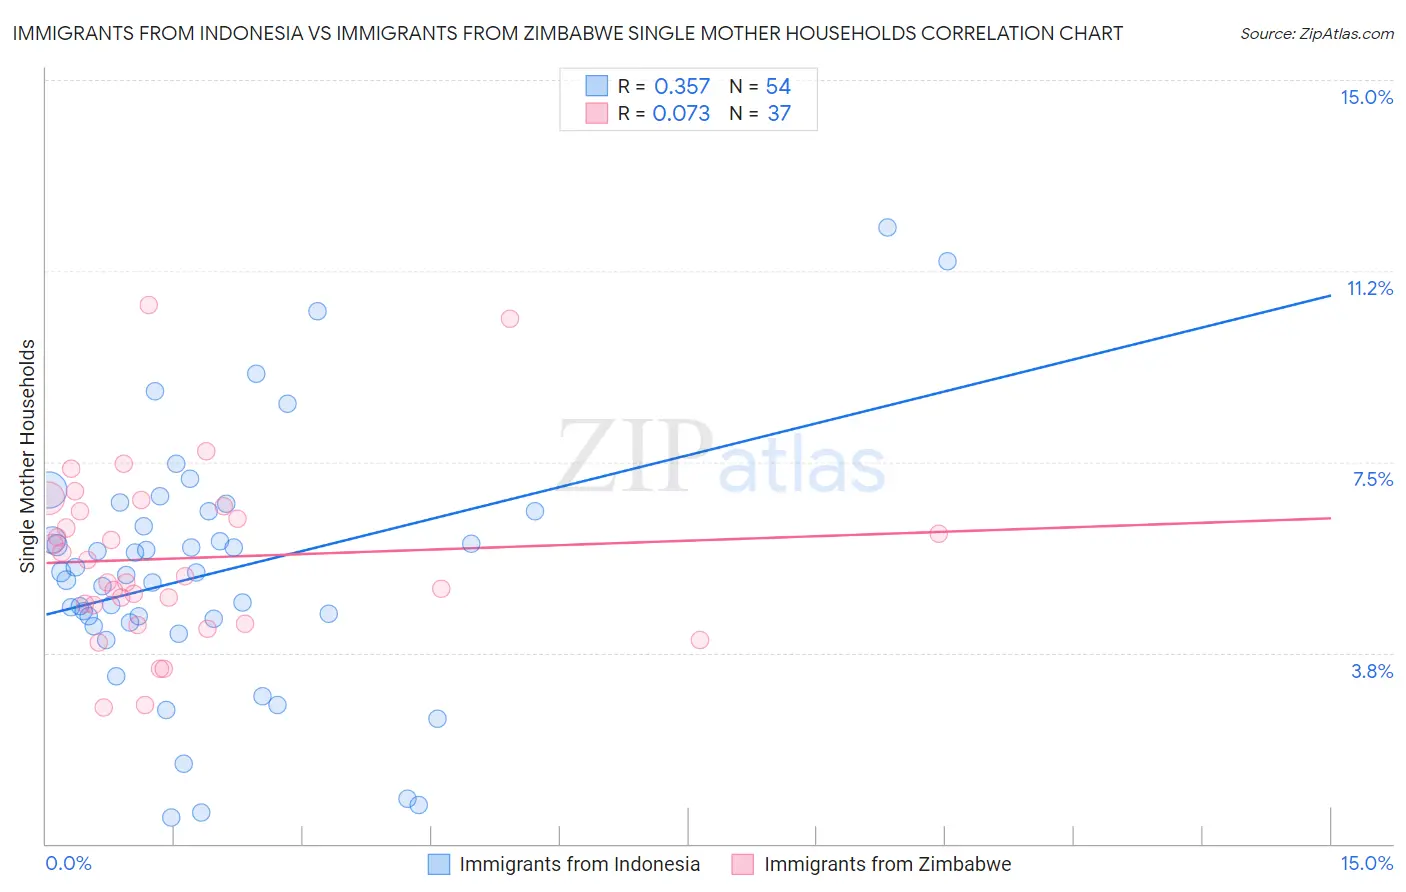
Immigrants from Indonesia vs Immigrants from Zimbabwe Single Mother Households Correlation Chart
The statistical analysis conducted on geographies consisting of 215,530,702 people shows a mild positive correlation between the proportion of Immigrants from Indonesia and percentage of single mother households in the United States with a correlation coefficient (R) of 0.357 and weighted average of 5.7%. Similarly, the statistical analysis conducted on geographies consisting of 117,740,181 people shows a slight positive correlation between the proportion of Immigrants from Zimbabwe and percentage of single mother households in the United States with a correlation coefficient (R) of 0.073 and weighted average of 6.2%, a difference of 8.2%.
Single Mother Households Correlation Summary
| Measurement | Immigrants from Indonesia | Immigrants from Zimbabwe |
| Minimum | 0.52% | 2.7% |
| Maximum | 12.1% | 10.6% |
| Range | 11.6% | 7.9% |
| Mean | 5.3% | 5.6% |
| Median | 5.3% | 5.2% |
| Interquartile 25% (IQ1) | 4.3% | 4.5% |
| Interquartile 75% (IQ3) | 6.5% | 6.6% |
| Interquartile Range (IQR) | 2.2% | 2.1% |
| Standard Deviation (Sample) | 2.4% | 1.7% |
| Standard Deviation (Population) | 2.4% | 1.7% |
Similar Demographics by Single Mother Households
Demographics Similar to Immigrants from Indonesia by Single Mother Households
In terms of single mother households, the demographic groups most similar to Immigrants from Indonesia are Ukrainian (5.7%, a difference of 0.060%), European (5.7%, a difference of 0.22%), Israeli (5.7%, a difference of 0.32%), Immigrants from Turkey (5.7%, a difference of 0.39%), and Immigrants from Western Asia (5.7%, a difference of 0.45%).
| Demographics | Rating | Rank | Single Mother Households |
| Immigrants | Hungary | 97.8 /100 | #83 | Exceptional 5.7% |
| Carpatho Rusyns | 97.7 /100 | #84 | Exceptional 5.7% |
| Hungarians | 97.6 /100 | #85 | Exceptional 5.7% |
| Finns | 97.6 /100 | #86 | Exceptional 5.7% |
| Immigrants | Turkey | 97.5 /100 | #87 | Exceptional 5.7% |
| Israelis | 97.4 /100 | #88 | Exceptional 5.7% |
| Ukrainians | 97.2 /100 | #89 | Exceptional 5.7% |
| Immigrants | Indonesia | 97.2 /100 | #90 | Exceptional 5.7% |
| Europeans | 97.0 /100 | #91 | Exceptional 5.7% |
| Immigrants | Western Asia | 96.7 /100 | #92 | Exceptional 5.7% |
| Serbians | 96.7 /100 | #93 | Exceptional 5.7% |
| Basques | 96.7 /100 | #94 | Exceptional 5.7% |
| Slovaks | 96.6 /100 | #95 | Exceptional 5.7% |
| Austrians | 96.4 /100 | #96 | Exceptional 5.7% |
| Tlingit-Haida | 96.4 /100 | #97 | Exceptional 5.7% |
Demographics Similar to Immigrants from Zimbabwe by Single Mother Households
In terms of single mother households, the demographic groups most similar to Immigrants from Zimbabwe are Alsatian (6.2%, a difference of 0.16%), Immigrants from Northern Africa (6.2%, a difference of 0.25%), Immigrants from Syria (6.2%, a difference of 0.32%), Immigrants from Germany (6.1%, a difference of 0.34%), and Iraqi (6.1%, a difference of 0.42%).
| Demographics | Rating | Rank | Single Mother Households |
| Whites/Caucasians | 76.5 /100 | #155 | Good 6.1% |
| Native Hawaiians | 75.0 /100 | #156 | Good 6.1% |
| Chileans | 74.2 /100 | #157 | Good 6.1% |
| Celtics | 73.3 /100 | #158 | Good 6.1% |
| Yugoslavians | 73.1 /100 | #159 | Good 6.1% |
| Iraqis | 73.0 /100 | #160 | Good 6.1% |
| Immigrants | Germany | 72.4 /100 | #161 | Good 6.1% |
| Immigrants | Zimbabwe | 69.9 /100 | #162 | Good 6.2% |
| Alsatians | 68.7 /100 | #163 | Good 6.2% |
| Immigrants | Northern Africa | 68.0 /100 | #164 | Good 6.2% |
| Immigrants | Syria | 67.4 /100 | #165 | Good 6.2% |
| Sri Lankans | 63.9 /100 | #166 | Good 6.2% |
| Brazilians | 59.1 /100 | #167 | Average 6.2% |
| Immigrants | Chile | 58.3 /100 | #168 | Average 6.3% |
| Puget Sound Salish | 58.1 /100 | #169 | Average 6.3% |