Yup'ik vs Immigrants from Zimbabwe 11th Grade
COMPARE
Yup'ik
Immigrants from Zimbabwe
11th Grade
11th Grade Comparison
Yup'ik
Immigrants from Zimbabwe
91.2%
11TH GRADE
0.3/ 100
METRIC RATING
264th/ 347
METRIC RANK
93.4%
11TH GRADE
97.8/ 100
METRIC RATING
113th/ 347
METRIC RANK
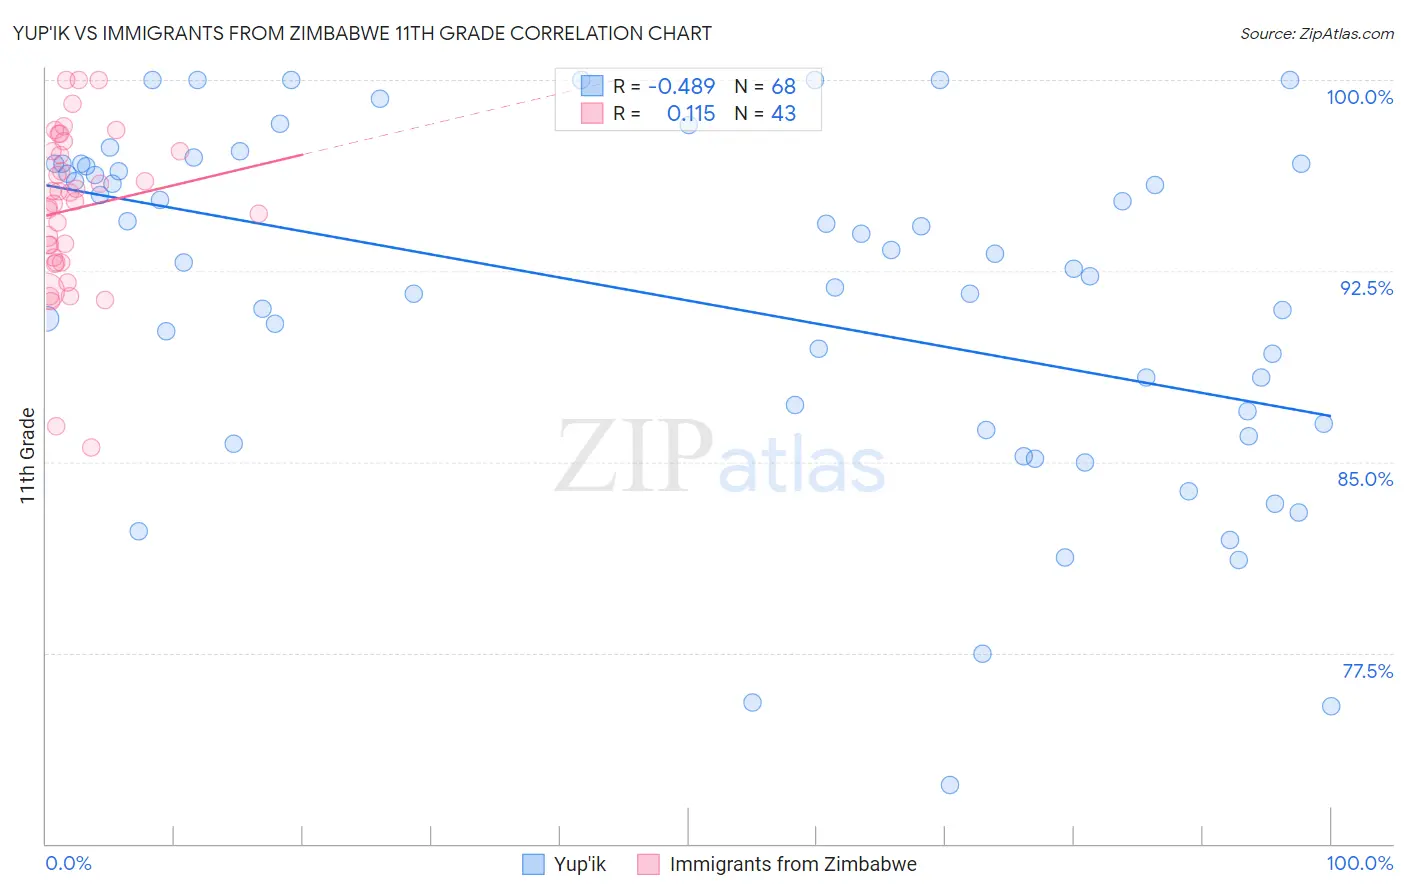
Yup'ik vs Immigrants from Zimbabwe 11th Grade Correlation Chart
The statistical analysis conducted on geographies consisting of 39,964,654 people shows a moderate negative correlation between the proportion of Yup'ik and percentage of population with at least 11th grade education in the United States with a correlation coefficient (R) of -0.489 and weighted average of 91.2%. Similarly, the statistical analysis conducted on geographies consisting of 117,809,656 people shows a poor positive correlation between the proportion of Immigrants from Zimbabwe and percentage of population with at least 11th grade education in the United States with a correlation coefficient (R) of 0.115 and weighted average of 93.4%, a difference of 2.4%.
11th Grade Correlation Summary
| Measurement | Yup'ik | Immigrants from Zimbabwe |
| Minimum | 72.3% | 85.5% |
| Maximum | 100.0% | 100.0% |
| Range | 27.7% | 14.5% |
| Mean | 91.3% | 94.9% |
| Median | 92.7% | 95.2% |
| Interquartile 25% (IQ1) | 86.4% | 92.8% |
| Interquartile 75% (IQ3) | 96.7% | 97.2% |
| Interquartile Range (IQR) | 10.3% | 4.4% |
| Standard Deviation (Sample) | 6.8% | 3.2% |
| Standard Deviation (Population) | 6.7% | 3.1% |
Similar Demographics by 11th Grade
Demographics Similar to Yup'ik by 11th Grade
In terms of 11th grade, the demographic groups most similar to Yup'ik are Pueblo (91.2%, a difference of 0.0%), Immigrants from Ghana (91.2%, a difference of 0.020%), Immigrants from Western Africa (91.2%, a difference of 0.030%), Immigrants from Jamaica (91.2%, a difference of 0.030%), and U.S. Virgin Islander (91.1%, a difference of 0.11%).
| Demographics | Rating | Rank | 11th Grade |
| Cajuns | 0.7 /100 | #257 | Tragic 91.4% |
| Immigrants | Colombia | 0.6 /100 | #258 | Tragic 91.4% |
| Jamaicans | 0.6 /100 | #259 | Tragic 91.4% |
| Spanish Americans | 0.6 /100 | #260 | Tragic 91.4% |
| Taiwanese | 0.6 /100 | #261 | Tragic 91.3% |
| Immigrants | Uruguay | 0.5 /100 | #262 | Tragic 91.3% |
| Immigrants | Ghana | 0.3 /100 | #263 | Tragic 91.2% |
| Yup'ik | 0.3 /100 | #264 | Tragic 91.2% |
| Pueblo | 0.3 /100 | #265 | Tragic 91.2% |
| Immigrants | Western Africa | 0.3 /100 | #266 | Tragic 91.2% |
| Immigrants | Jamaica | 0.3 /100 | #267 | Tragic 91.2% |
| U.S. Virgin Islanders | 0.2 /100 | #268 | Tragic 91.1% |
| Ute | 0.2 /100 | #269 | Tragic 91.1% |
| Trinidadians and Tobagonians | 0.2 /100 | #270 | Tragic 91.1% |
| Immigrants | Peru | 0.1 /100 | #271 | Tragic 91.0% |
Demographics Similar to Immigrants from Zimbabwe by 11th Grade
In terms of 11th grade, the demographic groups most similar to Immigrants from Zimbabwe are Jordanian (93.4%, a difference of 0.0%), Palestinian (93.4%, a difference of 0.020%), Yugoslavian (93.4%, a difference of 0.030%), Immigrants from Germany (93.4%, a difference of 0.030%), and Immigrants from Hungary (93.4%, a difference of 0.030%).
| Demographics | Rating | Rank | 11th Grade |
| Immigrants | Croatia | 98.6 /100 | #106 | Exceptional 93.5% |
| Immigrants | Norway | 98.4 /100 | #107 | Exceptional 93.5% |
| Alaska Natives | 98.4 /100 | #108 | Exceptional 93.5% |
| Immigrants | Kuwait | 98.4 /100 | #109 | Exceptional 93.5% |
| Syrians | 98.4 /100 | #110 | Exceptional 93.4% |
| Yugoslavians | 98.1 /100 | #111 | Exceptional 93.4% |
| Immigrants | Germany | 98.0 /100 | #112 | Exceptional 93.4% |
| Immigrants | Zimbabwe | 97.8 /100 | #113 | Exceptional 93.4% |
| Jordanians | 97.8 /100 | #114 | Exceptional 93.4% |
| Palestinians | 97.7 /100 | #115 | Exceptional 93.4% |
| Immigrants | Hungary | 97.5 /100 | #116 | Exceptional 93.4% |
| Whites/Caucasians | 97.4 /100 | #117 | Exceptional 93.3% |
| Immigrants | Korea | 97.0 /100 | #118 | Exceptional 93.3% |
| Israelis | 97.0 /100 | #119 | Exceptional 93.3% |
| Immigrants | Russia | 96.6 /100 | #120 | Exceptional 93.3% |