Yup'ik vs Immigrants from Latin America Single Mother Households
COMPARE
Yup'ik
Immigrants from Latin America
Single Mother Households
Single Mother Households Comparison
Yup'ik
Immigrants from Latin America
10.0%
SINGLE MOTHER HOUSEHOLDS
0.0/ 100
METRIC RATING
347th/ 347
METRIC RANK
7.9%
SINGLE MOTHER HOUSEHOLDS
0.0/ 100
METRIC RATING
296th/ 347
METRIC RANK
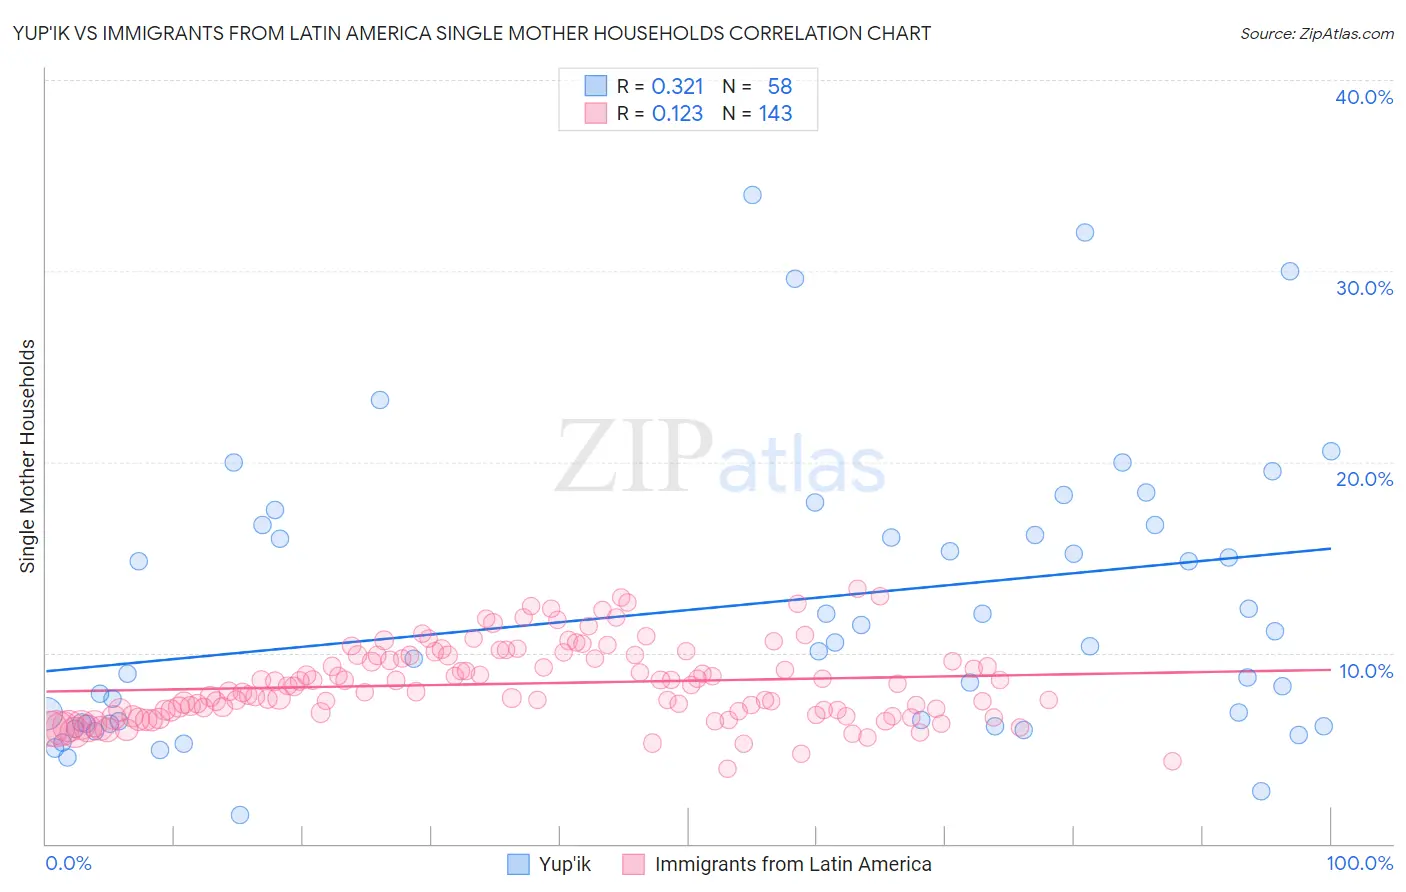
Yup'ik vs Immigrants from Latin America Single Mother Households Correlation Chart
The statistical analysis conducted on geographies consisting of 39,868,433 people shows a mild positive correlation between the proportion of Yup'ik and percentage of single mother households in the United States with a correlation coefficient (R) of 0.321 and weighted average of 10.0%. Similarly, the statistical analysis conducted on geographies consisting of 554,551,373 people shows a poor positive correlation between the proportion of Immigrants from Latin America and percentage of single mother households in the United States with a correlation coefficient (R) of 0.123 and weighted average of 7.9%, a difference of 26.5%.
Single Mother Households Correlation Summary
| Measurement | Yup'ik | Immigrants from Latin America |
| Minimum | 1.5% | 3.9% |
| Maximum | 34.0% | 13.3% |
| Range | 32.5% | 9.4% |
| Mean | 12.4% | 8.4% |
| Median | 10.4% | 8.2% |
| Interquartile 25% (IQ1) | 6.3% | 6.9% |
| Interquartile 75% (IQ3) | 16.7% | 9.9% |
| Interquartile Range (IQR) | 10.4% | 3.0% |
| Standard Deviation (Sample) | 7.4% | 2.0% |
| Standard Deviation (Population) | 7.4% | 2.0% |
Similar Demographics by Single Mother Households
Demographics Similar to Yup'ik by Single Mother Households
In terms of single mother households, the demographic groups most similar to Yup'ik are Yuman (9.6%, a difference of 3.8%), Immigrants from Cabo Verde (9.6%, a difference of 4.4%), Immigrants from Dominican Republic (9.5%, a difference of 5.2%), Dominican (9.2%, a difference of 8.9%), and Menominee (9.2%, a difference of 9.2%).
| Demographics | Rating | Rank | Single Mother Households |
| Liberians | 0.0 /100 | #333 | Tragic 8.6% |
| Immigrants | Liberia | 0.0 /100 | #334 | Tragic 8.7% |
| Immigrants | Dominica | 0.0 /100 | #335 | Tragic 8.7% |
| Puerto Ricans | 0.0 /100 | #336 | Tragic 8.7% |
| Navajo | 0.0 /100 | #337 | Tragic 8.8% |
| Cape Verdeans | 0.0 /100 | #338 | Tragic 8.9% |
| Blacks/African Americans | 0.0 /100 | #339 | Tragic 9.0% |
| Lumbee | 0.0 /100 | #340 | Tragic 9.1% |
| Tohono O'odham | 0.0 /100 | #341 | Tragic 9.1% |
| Menominee | 0.0 /100 | #342 | Tragic 9.2% |
| Dominicans | 0.0 /100 | #343 | Tragic 9.2% |
| Immigrants | Dominican Republic | 0.0 /100 | #344 | Tragic 9.5% |
| Immigrants | Cabo Verde | 0.0 /100 | #345 | Tragic 9.6% |
| Yuman | 0.0 /100 | #346 | Tragic 9.6% |
| Yup'ik | 0.0 /100 | #347 | Tragic 10.0% |
Demographics Similar to Immigrants from Latin America by Single Mother Households
In terms of single mother households, the demographic groups most similar to Immigrants from Latin America are Hispanic or Latino (7.9%, a difference of 0.040%), Barbadian (7.9%, a difference of 0.060%), Immigrants from West Indies (7.9%, a difference of 0.15%), Houma (7.9%, a difference of 0.23%), and Apache (7.9%, a difference of 0.35%).
| Demographics | Rating | Rank | Single Mother Households |
| Sub-Saharan Africans | 0.0 /100 | #289 | Tragic 7.8% |
| Immigrants | Nigeria | 0.0 /100 | #290 | Tragic 7.8% |
| West Indians | 0.0 /100 | #291 | Tragic 7.8% |
| Ghanaians | 0.0 /100 | #292 | Tragic 7.8% |
| Immigrants | Cameroon | 0.0 /100 | #293 | Tragic 7.9% |
| Apache | 0.0 /100 | #294 | Tragic 7.9% |
| Barbadians | 0.0 /100 | #295 | Tragic 7.9% |
| Immigrants | Latin America | 0.0 /100 | #296 | Tragic 7.9% |
| Hispanics or Latinos | 0.0 /100 | #297 | Tragic 7.9% |
| Immigrants | West Indies | 0.0 /100 | #298 | Tragic 7.9% |
| Houma | 0.0 /100 | #299 | Tragic 7.9% |
| Mexicans | 0.0 /100 | #300 | Tragic 8.0% |
| Chippewa | 0.0 /100 | #301 | Tragic 8.0% |
| Immigrants | Ghana | 0.0 /100 | #302 | Tragic 8.0% |
| Immigrants | Bahamas | 0.0 /100 | #303 | Tragic 8.0% |