Yugoslavian vs Alaska Native Single Father Households
COMPARE
Yugoslavian
Alaska Native
Single Father Households
Single Father Households Comparison
Yugoslavians
Alaska Natives
2.3%
SINGLE FATHER HOUSEHOLDS
43.9/ 100
METRIC RATING
180th/ 347
METRIC RANK
3.5%
SINGLE FATHER HOUSEHOLDS
0.0/ 100
METRIC RATING
340th/ 347
METRIC RANK
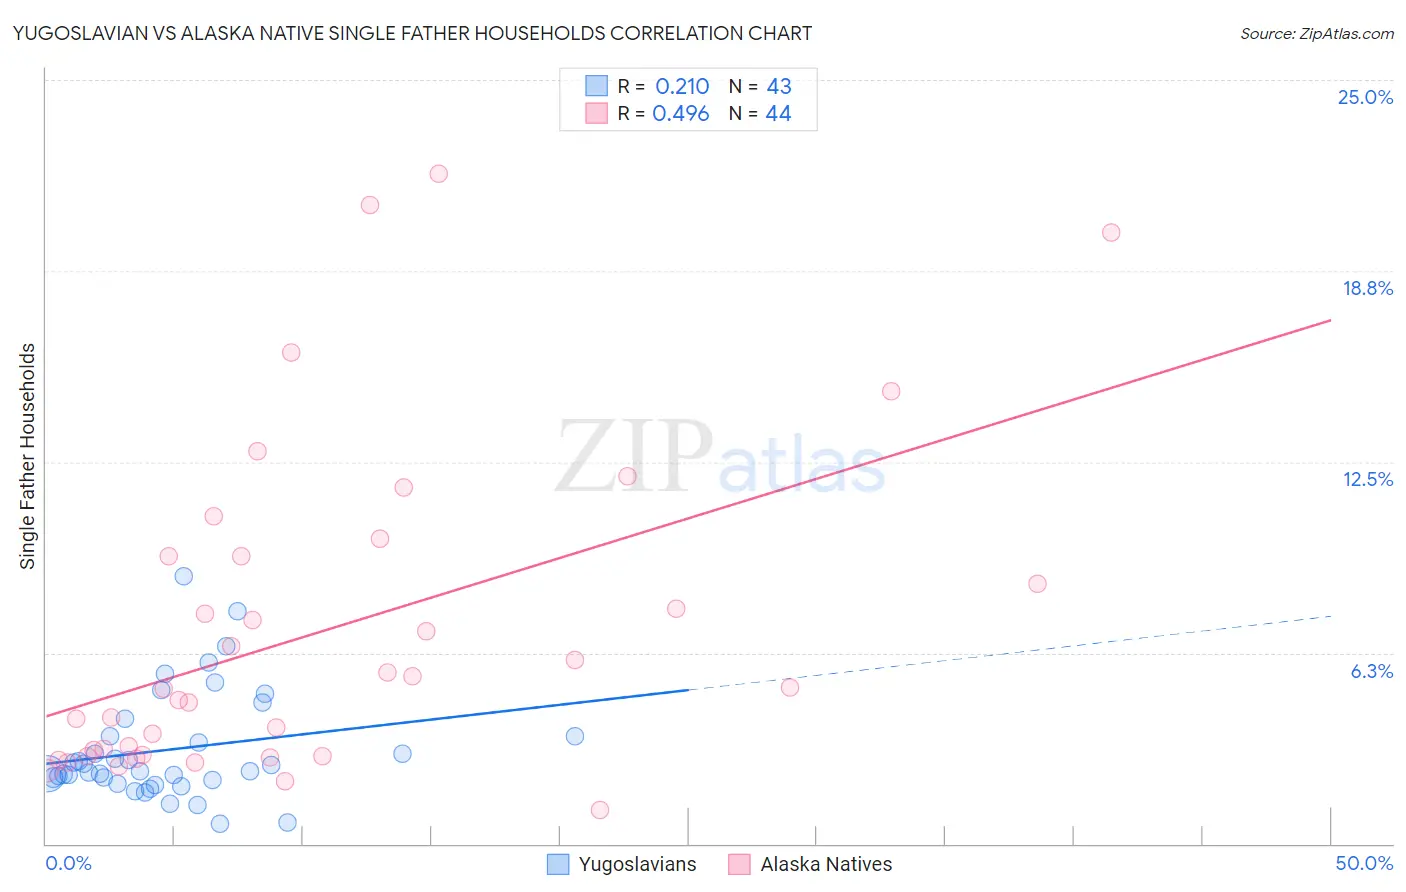
Yugoslavian vs Alaska Native Single Father Households Correlation Chart
The statistical analysis conducted on geographies consisting of 284,087,326 people shows a weak positive correlation between the proportion of Yugoslavians and percentage of single father households in the United States with a correlation coefficient (R) of 0.210 and weighted average of 2.3%. Similarly, the statistical analysis conducted on geographies consisting of 76,608,440 people shows a moderate positive correlation between the proportion of Alaska Natives and percentage of single father households in the United States with a correlation coefficient (R) of 0.496 and weighted average of 3.5%, a difference of 49.1%.
Single Father Households Correlation Summary
| Measurement | Yugoslavian | Alaska Native |
| Minimum | 0.67% | 1.1% |
| Maximum | 8.7% | 21.9% |
| Range | 8.1% | 20.8% |
| Mean | 3.1% | 7.0% |
| Median | 2.4% | 5.1% |
| Interquartile 25% (IQ1) | 2.1% | 2.9% |
| Interquartile 75% (IQ3) | 3.5% | 9.4% |
| Interquartile Range (IQR) | 1.5% | 6.5% |
| Standard Deviation (Sample) | 1.8% | 5.3% |
| Standard Deviation (Population) | 1.7% | 5.2% |
Similar Demographics by Single Father Households
Demographics Similar to Yugoslavians by Single Father Households
In terms of single father households, the demographic groups most similar to Yugoslavians are Welsh (2.3%, a difference of 0.010%), Costa Rican (2.3%, a difference of 0.020%), Jamaican (2.3%, a difference of 0.030%), Belgian (2.3%, a difference of 0.040%), and Immigrants from Panama (2.4%, a difference of 0.15%).
| Demographics | Rating | Rank | Single Father Households |
| Celtics | 55.4 /100 | #173 | Average 2.3% |
| Afghans | 50.0 /100 | #174 | Average 2.3% |
| Immigrants | Jamaica | 49.1 /100 | #175 | Average 2.3% |
| Danes | 48.2 /100 | #176 | Average 2.3% |
| Colombians | 48.0 /100 | #177 | Average 2.3% |
| Costa Ricans | 44.1 /100 | #178 | Average 2.3% |
| Welsh | 44.0 /100 | #179 | Average 2.3% |
| Yugoslavians | 43.9 /100 | #180 | Average 2.3% |
| Jamaicans | 43.5 /100 | #181 | Average 2.3% |
| Belgians | 43.3 /100 | #182 | Average 2.3% |
| Immigrants | Panama | 41.8 /100 | #183 | Average 2.4% |
| Sri Lankans | 41.8 /100 | #184 | Average 2.4% |
| Nigerians | 41.0 /100 | #185 | Average 2.4% |
| Immigrants | Bosnia and Herzegovina | 40.4 /100 | #186 | Average 2.4% |
| Immigrants | Colombia | 34.0 /100 | #187 | Fair 2.4% |
Demographics Similar to Alaska Natives by Single Father Households
In terms of single father households, the demographic groups most similar to Alaska Natives are Crow (3.5%, a difference of 0.35%), Alaskan Athabascan (3.4%, a difference of 3.8%), Sioux (3.3%, a difference of 5.3%), Pueblo (3.3%, a difference of 6.0%), and Paiute (3.3%, a difference of 6.2%).
| Demographics | Rating | Rank | Single Father Households |
| Natives/Alaskans | 0.0 /100 | #333 | Tragic 3.2% |
| Yuman | 0.0 /100 | #334 | Tragic 3.3% |
| Colville | 0.0 /100 | #335 | Tragic 3.3% |
| Paiute | 0.0 /100 | #336 | Tragic 3.3% |
| Pueblo | 0.0 /100 | #337 | Tragic 3.3% |
| Sioux | 0.0 /100 | #338 | Tragic 3.3% |
| Alaskan Athabascans | 0.0 /100 | #339 | Tragic 3.4% |
| Alaska Natives | 0.0 /100 | #340 | Tragic 3.5% |
| Crow | 0.0 /100 | #341 | Tragic 3.5% |
| Tohono O'odham | 0.0 /100 | #342 | Tragic 3.8% |
| Pima | 0.0 /100 | #343 | Tragic 4.2% |
| Yakama | 0.0 /100 | #344 | Tragic 4.2% |
| Menominee | 0.0 /100 | #345 | Tragic 4.2% |
| Inupiat | 0.0 /100 | #346 | Tragic 4.9% |
| Yup'ik | 0.0 /100 | #347 | Tragic 5.4% |