Yugoslavian vs Immigrants from Bolivia Single Father Households
COMPARE
Yugoslavian
Immigrants from Bolivia
Single Father Households
Single Father Households Comparison
Yugoslavians
Immigrants from Bolivia
2.3%
SINGLE FATHER HOUSEHOLDS
43.9/ 100
METRIC RATING
180th/ 347
METRIC RANK
2.3%
SINGLE FATHER HOUSEHOLDS
76.3/ 100
METRIC RATING
160th/ 347
METRIC RANK
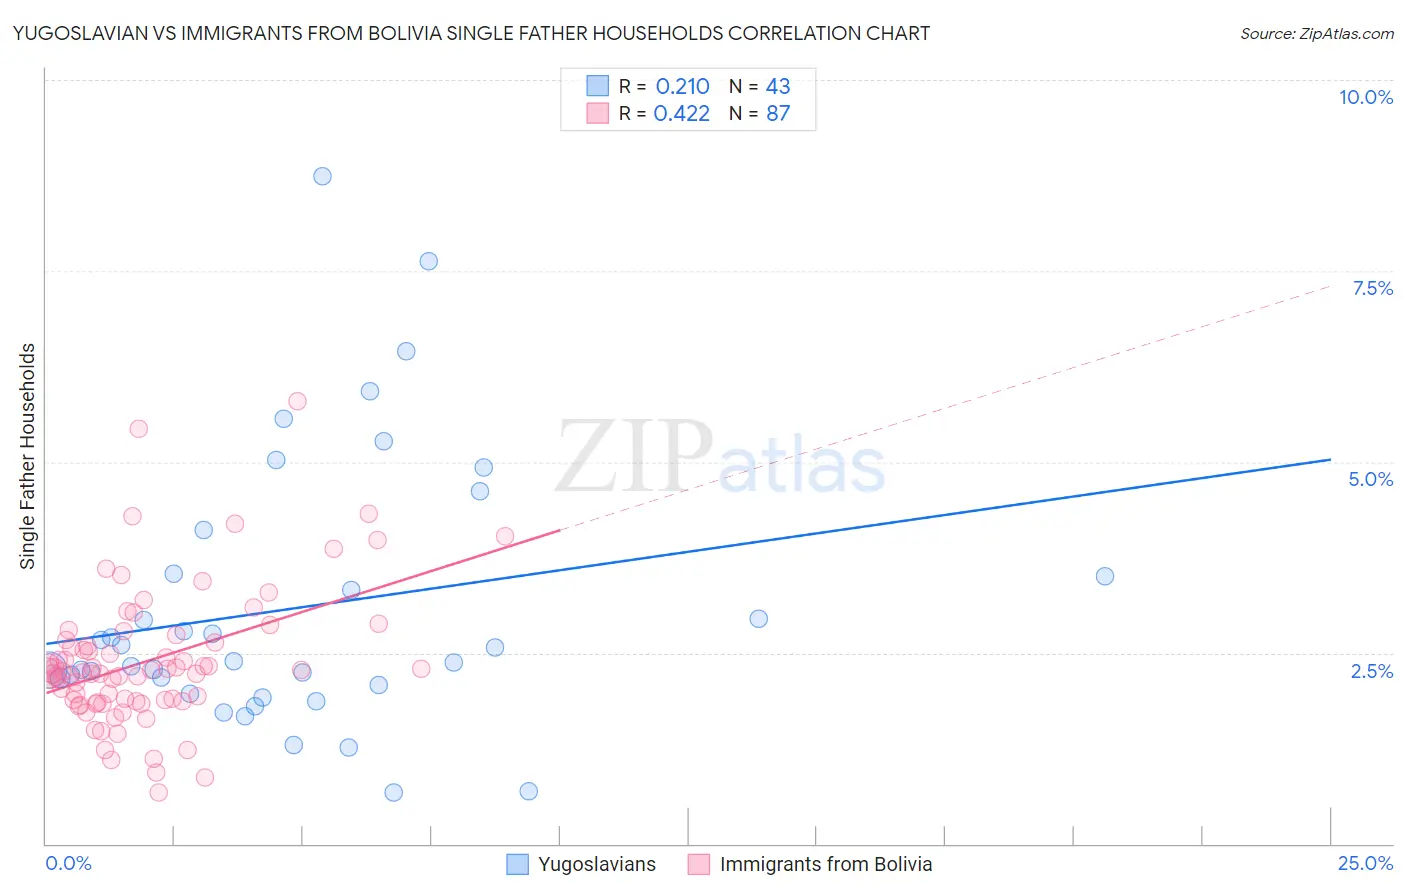
Yugoslavian vs Immigrants from Bolivia Single Father Households Correlation Chart
The statistical analysis conducted on geographies consisting of 284,087,326 people shows a weak positive correlation between the proportion of Yugoslavians and percentage of single father households in the United States with a correlation coefficient (R) of 0.210 and weighted average of 2.3%. Similarly, the statistical analysis conducted on geographies consisting of 158,280,287 people shows a moderate positive correlation between the proportion of Immigrants from Bolivia and percentage of single father households in the United States with a correlation coefficient (R) of 0.422 and weighted average of 2.3%, a difference of 2.6%.
Single Father Households Correlation Summary
| Measurement | Yugoslavian | Immigrants from Bolivia |
| Minimum | 0.67% | 0.67% |
| Maximum | 8.7% | 5.8% |
| Range | 8.1% | 5.1% |
| Mean | 3.1% | 2.4% |
| Median | 2.4% | 2.3% |
| Interquartile 25% (IQ1) | 2.1% | 1.9% |
| Interquartile 75% (IQ3) | 3.5% | 2.7% |
| Interquartile Range (IQR) | 1.5% | 0.80% |
| Standard Deviation (Sample) | 1.8% | 0.90% |
| Standard Deviation (Population) | 1.7% | 0.89% |
Demographics Similar to Yugoslavians and Immigrants from Bolivia by Single Father Households
In terms of single father households, the demographic groups most similar to Yugoslavians are Welsh (2.3%, a difference of 0.010%), Costa Rican (2.3%, a difference of 0.020%), Colombian (2.3%, a difference of 0.31%), Danish (2.3%, a difference of 0.32%), and Immigrants from Jamaica (2.3%, a difference of 0.39%). Similarly, the demographic groups most similar to Immigrants from Bolivia are Swiss (2.3%, a difference of 0.30%), Scottish (2.3%, a difference of 0.34%), Irish (2.3%, a difference of 0.41%), Pakistani (2.3%, a difference of 0.55%), and Scotch-Irish (2.3%, a difference of 0.65%).
| Demographics | Rating | Rank | Single Father Households |
| Immigrants | Bolivia | 76.3 /100 | #160 | Good 2.3% |
| Swiss | 73.2 /100 | #161 | Good 2.3% |
| Scottish | 72.8 /100 | #162 | Good 2.3% |
| Irish | 72.1 /100 | #163 | Good 2.3% |
| Pakistanis | 70.6 /100 | #164 | Good 2.3% |
| Scotch-Irish | 69.4 /100 | #165 | Good 2.3% |
| English | 68.6 /100 | #166 | Good 2.3% |
| South Americans | 64.3 /100 | #167 | Good 2.3% |
| Icelanders | 63.1 /100 | #168 | Good 2.3% |
| Czechs | 62.5 /100 | #169 | Good 2.3% |
| Ugandans | 62.2 /100 | #170 | Good 2.3% |
| Swedes | 61.6 /100 | #171 | Good 2.3% |
| Czechoslovakians | 58.9 /100 | #172 | Average 2.3% |
| Celtics | 55.4 /100 | #173 | Average 2.3% |
| Afghans | 50.0 /100 | #174 | Average 2.3% |
| Immigrants | Jamaica | 49.1 /100 | #175 | Average 2.3% |
| Danes | 48.2 /100 | #176 | Average 2.3% |
| Colombians | 48.0 /100 | #177 | Average 2.3% |
| Costa Ricans | 44.1 /100 | #178 | Average 2.3% |
| Welsh | 44.0 /100 | #179 | Average 2.3% |
| Yugoslavians | 43.9 /100 | #180 | Average 2.3% |