Yugoslavian vs Immigrants from Uganda Single Father Households
COMPARE
Yugoslavian
Immigrants from Uganda
Single Father Households
Single Father Households Comparison
Yugoslavians
Immigrants from Uganda
2.3%
SINGLE FATHER HOUSEHOLDS
43.9/ 100
METRIC RATING
180th/ 347
METRIC RANK
2.4%
SINGLE FATHER HOUSEHOLDS
26.0/ 100
METRIC RATING
201st/ 347
METRIC RANK
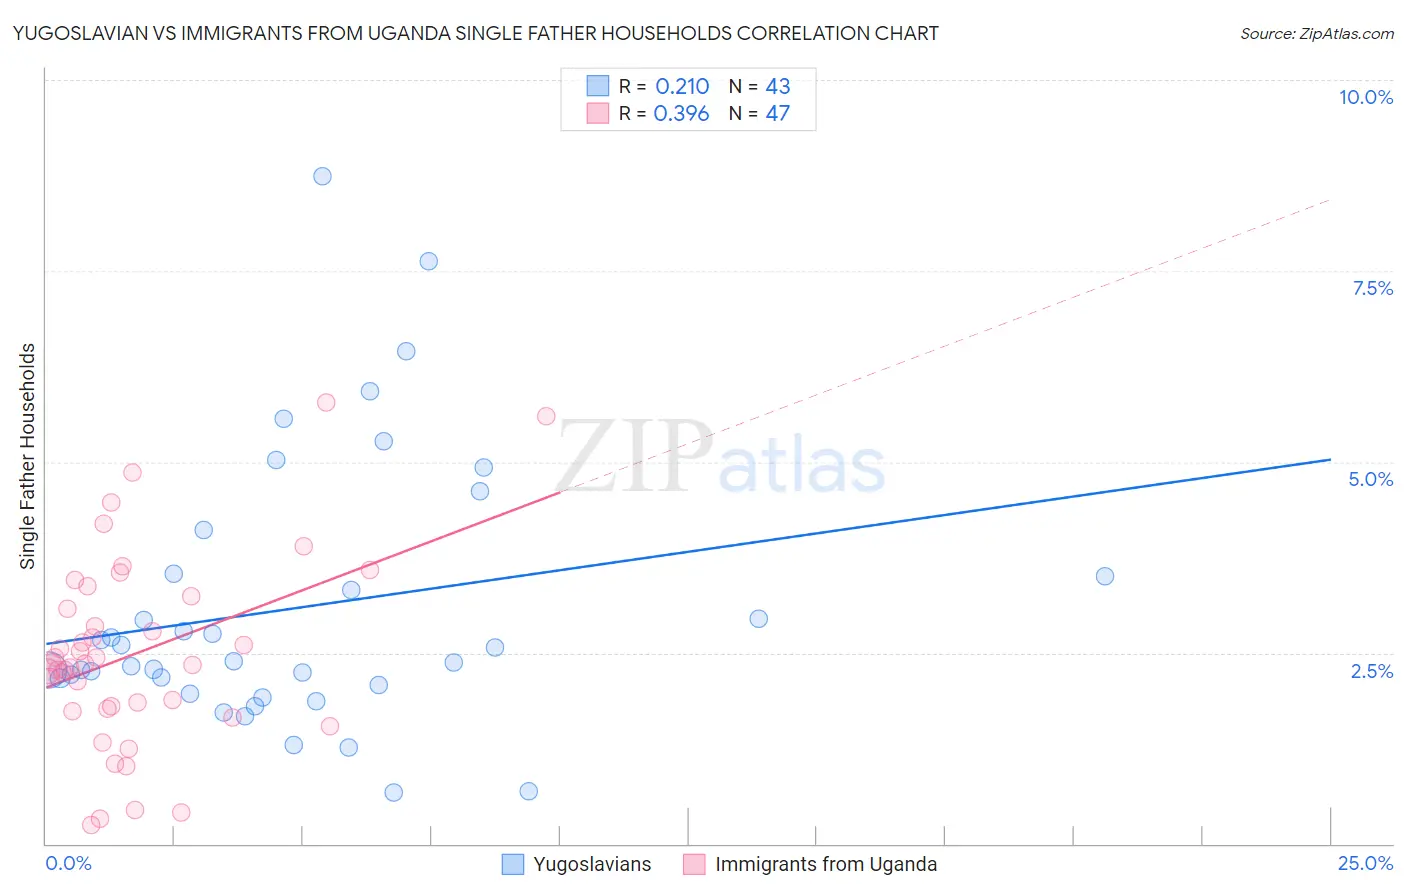
Yugoslavian vs Immigrants from Uganda Single Father Households Correlation Chart
The statistical analysis conducted on geographies consisting of 284,087,326 people shows a weak positive correlation between the proportion of Yugoslavians and percentage of single father households in the United States with a correlation coefficient (R) of 0.210 and weighted average of 2.3%. Similarly, the statistical analysis conducted on geographies consisting of 125,685,639 people shows a mild positive correlation between the proportion of Immigrants from Uganda and percentage of single father households in the United States with a correlation coefficient (R) of 0.396 and weighted average of 2.4%, a difference of 1.5%.
Single Father Households Correlation Summary
| Measurement | Yugoslavian | Immigrants from Uganda |
| Minimum | 0.67% | 0.24% |
| Maximum | 8.7% | 5.8% |
| Range | 8.1% | 5.5% |
| Mean | 3.1% | 2.5% |
| Median | 2.4% | 2.4% |
| Interquartile 25% (IQ1) | 2.1% | 1.8% |
| Interquartile 75% (IQ3) | 3.5% | 3.2% |
| Interquartile Range (IQR) | 1.5% | 1.5% |
| Standard Deviation (Sample) | 1.8% | 1.2% |
| Standard Deviation (Population) | 1.7% | 1.2% |
Similar Demographics by Single Father Households
Demographics Similar to Yugoslavians by Single Father Households
In terms of single father households, the demographic groups most similar to Yugoslavians are Welsh (2.3%, a difference of 0.010%), Costa Rican (2.3%, a difference of 0.020%), Jamaican (2.3%, a difference of 0.030%), Belgian (2.3%, a difference of 0.040%), and Immigrants from Panama (2.4%, a difference of 0.15%).
| Demographics | Rating | Rank | Single Father Households |
| Celtics | 55.4 /100 | #173 | Average 2.3% |
| Afghans | 50.0 /100 | #174 | Average 2.3% |
| Immigrants | Jamaica | 49.1 /100 | #175 | Average 2.3% |
| Danes | 48.2 /100 | #176 | Average 2.3% |
| Colombians | 48.0 /100 | #177 | Average 2.3% |
| Costa Ricans | 44.1 /100 | #178 | Average 2.3% |
| Welsh | 44.0 /100 | #179 | Average 2.3% |
| Yugoslavians | 43.9 /100 | #180 | Average 2.3% |
| Jamaicans | 43.5 /100 | #181 | Average 2.3% |
| Belgians | 43.3 /100 | #182 | Average 2.3% |
| Immigrants | Panama | 41.8 /100 | #183 | Average 2.4% |
| Sri Lankans | 41.8 /100 | #184 | Average 2.4% |
| Nigerians | 41.0 /100 | #185 | Average 2.4% |
| Immigrants | Bosnia and Herzegovina | 40.4 /100 | #186 | Average 2.4% |
| Immigrants | Colombia | 34.0 /100 | #187 | Fair 2.4% |
Demographics Similar to Immigrants from Uganda by Single Father Households
In terms of single father households, the demographic groups most similar to Immigrants from Uganda are German Russian (2.4%, a difference of 0.030%), Immigrants from Vietnam (2.4%, a difference of 0.10%), Peruvian (2.4%, a difference of 0.10%), Scandinavian (2.4%, a difference of 0.13%), and French Canadian (2.4%, a difference of 0.13%).
| Demographics | Rating | Rank | Single Father Households |
| Panamanians | 29.6 /100 | #194 | Fair 2.4% |
| Immigrants | Philippines | 28.7 /100 | #195 | Fair 2.4% |
| Kenyans | 28.0 /100 | #196 | Fair 2.4% |
| Germans | 28.0 /100 | #197 | Fair 2.4% |
| Scandinavians | 27.4 /100 | #198 | Fair 2.4% |
| Immigrants | Vietnam | 27.1 /100 | #199 | Fair 2.4% |
| Peruvians | 27.1 /100 | #200 | Fair 2.4% |
| Immigrants | Uganda | 26.0 /100 | #201 | Fair 2.4% |
| German Russians | 25.7 /100 | #202 | Fair 2.4% |
| French Canadians | 24.7 /100 | #203 | Fair 2.4% |
| Ecuadorians | 24.5 /100 | #204 | Fair 2.4% |
| Immigrants | Afghanistan | 24.2 /100 | #205 | Fair 2.4% |
| Koreans | 24.1 /100 | #206 | Fair 2.4% |
| Whites/Caucasians | 22.6 /100 | #207 | Fair 2.4% |
| Immigrants | Kenya | 20.3 /100 | #208 | Fair 2.4% |