Yugoslavian vs Japanese Single Father Households
COMPARE
Yugoslavian
Japanese
Single Father Households
Single Father Households Comparison
Yugoslavians
Japanese
2.3%
SINGLE FATHER HOUSEHOLDS
43.9/ 100
METRIC RATING
180th/ 347
METRIC RANK
2.8%
SINGLE FATHER HOUSEHOLDS
0.0/ 100
METRIC RATING
296th/ 347
METRIC RANK
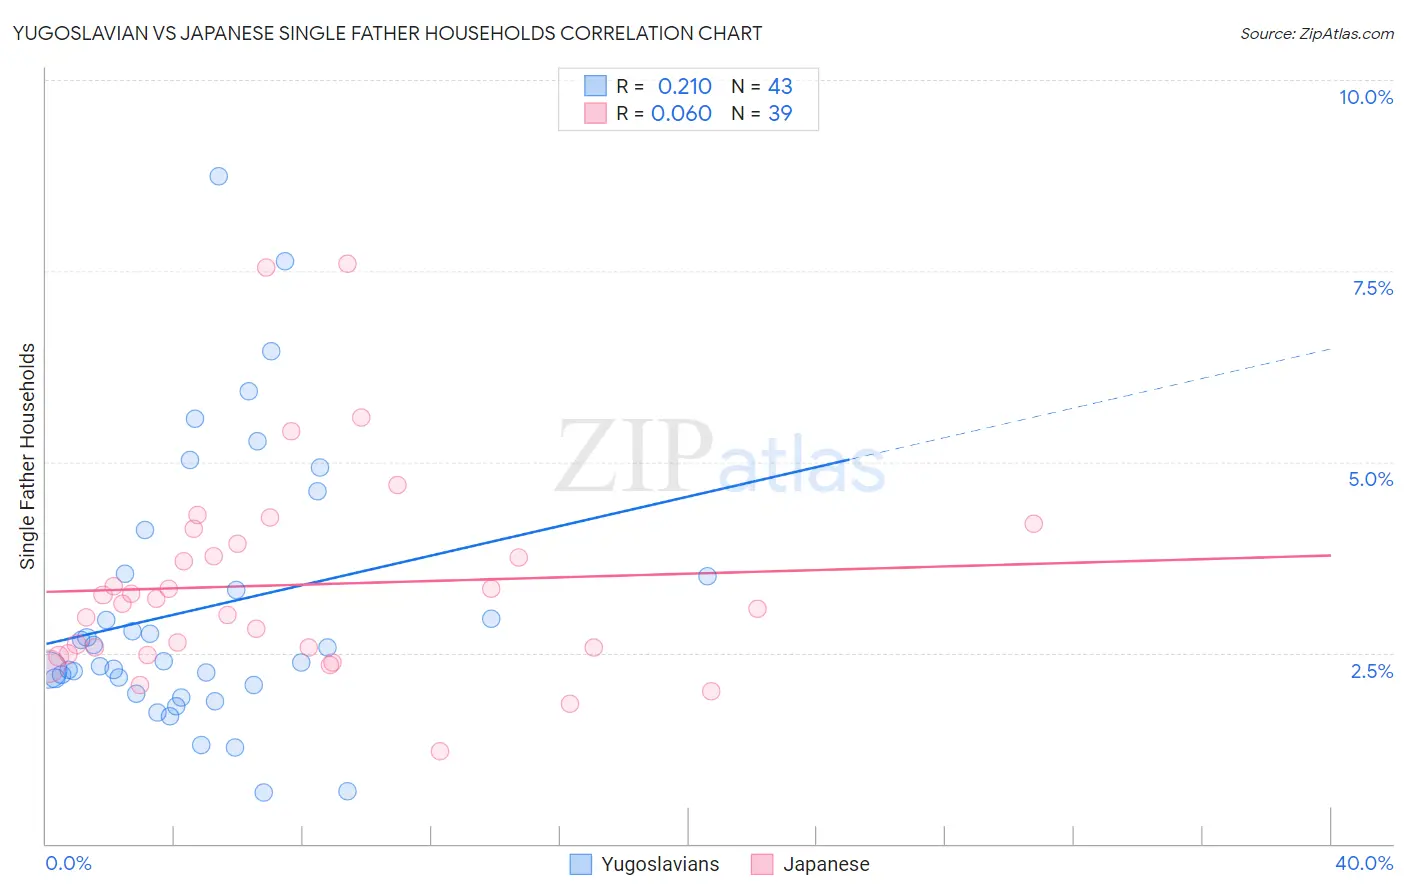
Yugoslavian vs Japanese Single Father Households Correlation Chart
The statistical analysis conducted on geographies consisting of 284,087,326 people shows a weak positive correlation between the proportion of Yugoslavians and percentage of single father households in the United States with a correlation coefficient (R) of 0.210 and weighted average of 2.3%. Similarly, the statistical analysis conducted on geographies consisting of 248,286,499 people shows a slight positive correlation between the proportion of Japanese and percentage of single father households in the United States with a correlation coefficient (R) of 0.060 and weighted average of 2.8%, a difference of 17.2%.
Single Father Households Correlation Summary
| Measurement | Yugoslavian | Japanese |
| Minimum | 0.67% | 1.2% |
| Maximum | 8.7% | 7.6% |
| Range | 8.1% | 6.4% |
| Mean | 3.1% | 3.4% |
| Median | 2.4% | 3.1% |
| Interquartile 25% (IQ1) | 2.1% | 2.5% |
| Interquartile 75% (IQ3) | 3.5% | 3.9% |
| Interquartile Range (IQR) | 1.5% | 1.4% |
| Standard Deviation (Sample) | 1.8% | 1.4% |
| Standard Deviation (Population) | 1.7% | 1.3% |
Similar Demographics by Single Father Households
Demographics Similar to Yugoslavians by Single Father Households
In terms of single father households, the demographic groups most similar to Yugoslavians are Welsh (2.3%, a difference of 0.010%), Costa Rican (2.3%, a difference of 0.020%), Jamaican (2.3%, a difference of 0.030%), Belgian (2.3%, a difference of 0.040%), and Immigrants from Panama (2.4%, a difference of 0.15%).
| Demographics | Rating | Rank | Single Father Households |
| Celtics | 55.4 /100 | #173 | Average 2.3% |
| Afghans | 50.0 /100 | #174 | Average 2.3% |
| Immigrants | Jamaica | 49.1 /100 | #175 | Average 2.3% |
| Danes | 48.2 /100 | #176 | Average 2.3% |
| Colombians | 48.0 /100 | #177 | Average 2.3% |
| Costa Ricans | 44.1 /100 | #178 | Average 2.3% |
| Welsh | 44.0 /100 | #179 | Average 2.3% |
| Yugoslavians | 43.9 /100 | #180 | Average 2.3% |
| Jamaicans | 43.5 /100 | #181 | Average 2.3% |
| Belgians | 43.3 /100 | #182 | Average 2.3% |
| Immigrants | Panama | 41.8 /100 | #183 | Average 2.4% |
| Sri Lankans | 41.8 /100 | #184 | Average 2.4% |
| Nigerians | 41.0 /100 | #185 | Average 2.4% |
| Immigrants | Bosnia and Herzegovina | 40.4 /100 | #186 | Average 2.4% |
| Immigrants | Colombia | 34.0 /100 | #187 | Fair 2.4% |
Demographics Similar to Japanese by Single Father Households
In terms of single father households, the demographic groups most similar to Japanese are Chickasaw (2.8%, a difference of 0.020%), Honduran (2.8%, a difference of 0.080%), Cree (2.8%, a difference of 0.57%), Malaysian (2.7%, a difference of 0.83%), and Lumbee (2.8%, a difference of 0.95%).
| Demographics | Rating | Rank | Single Father Households |
| Tlingit-Haida | 0.0 /100 | #289 | Tragic 2.7% |
| Puget Sound Salish | 0.0 /100 | #290 | Tragic 2.7% |
| Blackfeet | 0.0 /100 | #291 | Tragic 2.7% |
| Choctaw | 0.0 /100 | #292 | Tragic 2.7% |
| Immigrants | Fiji | 0.0 /100 | #293 | Tragic 2.7% |
| Malaysians | 0.0 /100 | #294 | Tragic 2.7% |
| Chickasaw | 0.0 /100 | #295 | Tragic 2.8% |
| Japanese | 0.0 /100 | #296 | Tragic 2.8% |
| Hondurans | 0.0 /100 | #297 | Tragic 2.8% |
| Cree | 0.0 /100 | #298 | Tragic 2.8% |
| Lumbee | 0.0 /100 | #299 | Tragic 2.8% |
| Kiowa | 0.0 /100 | #300 | Tragic 2.8% |
| Immigrants | Latin America | 0.0 /100 | #301 | Tragic 2.8% |
| Spanish Americans | 0.0 /100 | #302 | Tragic 2.8% |
| Immigrants | Honduras | 0.0 /100 | #303 | Tragic 2.8% |