Immigrants from Saudi Arabia vs Potawatomi Divorced or Separated
COMPARE
Immigrants from Saudi Arabia
Potawatomi
Divorced or Separated
Divorced or Separated Comparison
Immigrants from Saudi Arabia
Potawatomi
11.2%
DIVORCED OR SEPARATED
100.0/ 100
METRIC RATING
49th/ 347
METRIC RANK
13.5%
DIVORCED OR SEPARATED
0.0/ 100
METRIC RATING
325th/ 347
METRIC RANK
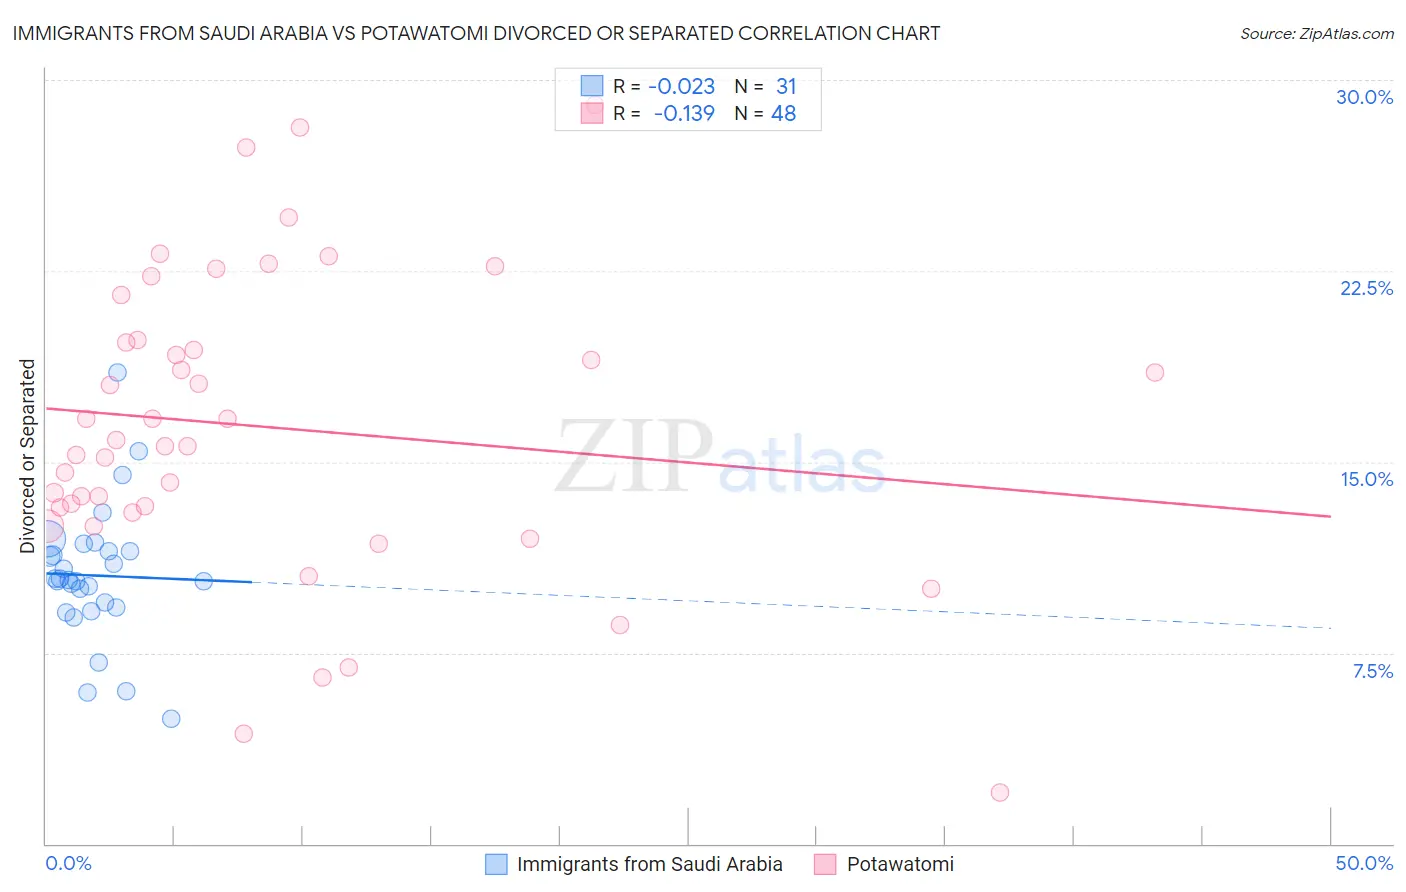
Immigrants from Saudi Arabia vs Potawatomi Divorced or Separated Correlation Chart
The statistical analysis conducted on geographies consisting of 164,229,737 people shows no correlation between the proportion of Immigrants from Saudi Arabia and percentage of population currently divorced or separated in the United States with a correlation coefficient (R) of -0.023 and weighted average of 11.2%. Similarly, the statistical analysis conducted on geographies consisting of 117,768,294 people shows a poor negative correlation between the proportion of Potawatomi and percentage of population currently divorced or separated in the United States with a correlation coefficient (R) of -0.139 and weighted average of 13.5%, a difference of 20.1%.
Divorced or Separated Correlation Summary
| Measurement | Immigrants from Saudi Arabia | Potawatomi |
| Minimum | 4.9% | 2.0% |
| Maximum | 18.5% | 29.0% |
| Range | 13.6% | 27.0% |
| Mean | 10.5% | 16.4% |
| Median | 10.4% | 15.7% |
| Interquartile 25% (IQ1) | 9.3% | 13.1% |
| Interquartile 75% (IQ3) | 11.5% | 19.7% |
| Interquartile Range (IQR) | 2.2% | 6.6% |
| Standard Deviation (Sample) | 2.7% | 5.9% |
| Standard Deviation (Population) | 2.6% | 5.8% |
Similar Demographics by Divorced or Separated
Demographics Similar to Immigrants from Saudi Arabia by Divorced or Separated
In terms of divorced or separated, the demographic groups most similar to Immigrants from Saudi Arabia are Immigrants from Turkey (11.2%, a difference of 0.010%), Immigrants from Poland (11.2%, a difference of 0.040%), Laotian (11.2%, a difference of 0.050%), Bolivian (11.2%, a difference of 0.070%), and Turkish (11.2%, a difference of 0.16%).
| Demographics | Rating | Rank | Divorced or Separated |
| Chinese | 100.0 /100 | #42 | Exceptional 11.2% |
| Immigrants | Belarus | 100.0 /100 | #43 | Exceptional 11.2% |
| Immigrants | Western Asia | 100.0 /100 | #44 | Exceptional 11.2% |
| Turks | 100.0 /100 | #45 | Exceptional 11.2% |
| Laotians | 100.0 /100 | #46 | Exceptional 11.2% |
| Immigrants | Poland | 100.0 /100 | #47 | Exceptional 11.2% |
| Immigrants | Turkey | 100.0 /100 | #48 | Exceptional 11.2% |
| Immigrants | Saudi Arabia | 100.0 /100 | #49 | Exceptional 11.2% |
| Bolivians | 100.0 /100 | #50 | Exceptional 11.2% |
| Immigrants | Bolivia | 100.0 /100 | #51 | Exceptional 11.3% |
| Immigrants | Australia | 99.9 /100 | #52 | Exceptional 11.3% |
| Immigrants | Lithuania | 99.9 /100 | #53 | Exceptional 11.3% |
| Eastern Europeans | 99.9 /100 | #54 | Exceptional 11.3% |
| Immigrants | Yemen | 99.9 /100 | #55 | Exceptional 11.3% |
| Immigrants | Philippines | 99.9 /100 | #56 | Exceptional 11.3% |
Demographics Similar to Potawatomi by Divorced or Separated
In terms of divorced or separated, the demographic groups most similar to Potawatomi are Immigrants from Congo (13.5%, a difference of 0.010%), Osage (13.4%, a difference of 0.060%), U.S. Virgin Islander (13.4%, a difference of 0.13%), Immigrants from Haiti (13.4%, a difference of 0.35%), and Comanche (13.5%, a difference of 0.49%).
| Demographics | Rating | Rank | Divorced or Separated |
| Cree | 0.0 /100 | #318 | Tragic 13.4% |
| Puget Sound Salish | 0.0 /100 | #319 | Tragic 13.4% |
| Cajuns | 0.0 /100 | #320 | Tragic 13.4% |
| Cheyenne | 0.0 /100 | #321 | Tragic 13.4% |
| Immigrants | Haiti | 0.0 /100 | #322 | Tragic 13.4% |
| U.S. Virgin Islanders | 0.0 /100 | #323 | Tragic 13.4% |
| Osage | 0.0 /100 | #324 | Tragic 13.4% |
| Potawatomi | 0.0 /100 | #325 | Tragic 13.5% |
| Immigrants | Congo | 0.0 /100 | #326 | Tragic 13.5% |
| Comanche | 0.0 /100 | #327 | Tragic 13.5% |
| Immigrants | Caribbean | 0.0 /100 | #328 | Tragic 13.6% |
| Houma | 0.0 /100 | #329 | Tragic 13.6% |
| Paiute | 0.0 /100 | #330 | Tragic 13.6% |
| Blacks/African Americans | 0.0 /100 | #331 | Tragic 13.6% |
| Cherokee | 0.0 /100 | #332 | Tragic 13.7% |