Spanish vs Immigrants from Russia Average Family Size
COMPARE
Spanish
Immigrants from Russia
Average Family Size
Average Family Size Comparison
Spanish
Immigrants from Russia
3.23
AVERAGE FAMILY SIZE
44.8/ 100
METRIC RATING
181st/ 347
METRIC RANK
3.16
AVERAGE FAMILY SIZE
1.3/ 100
METRIC RATING
262nd/ 347
METRIC RANK
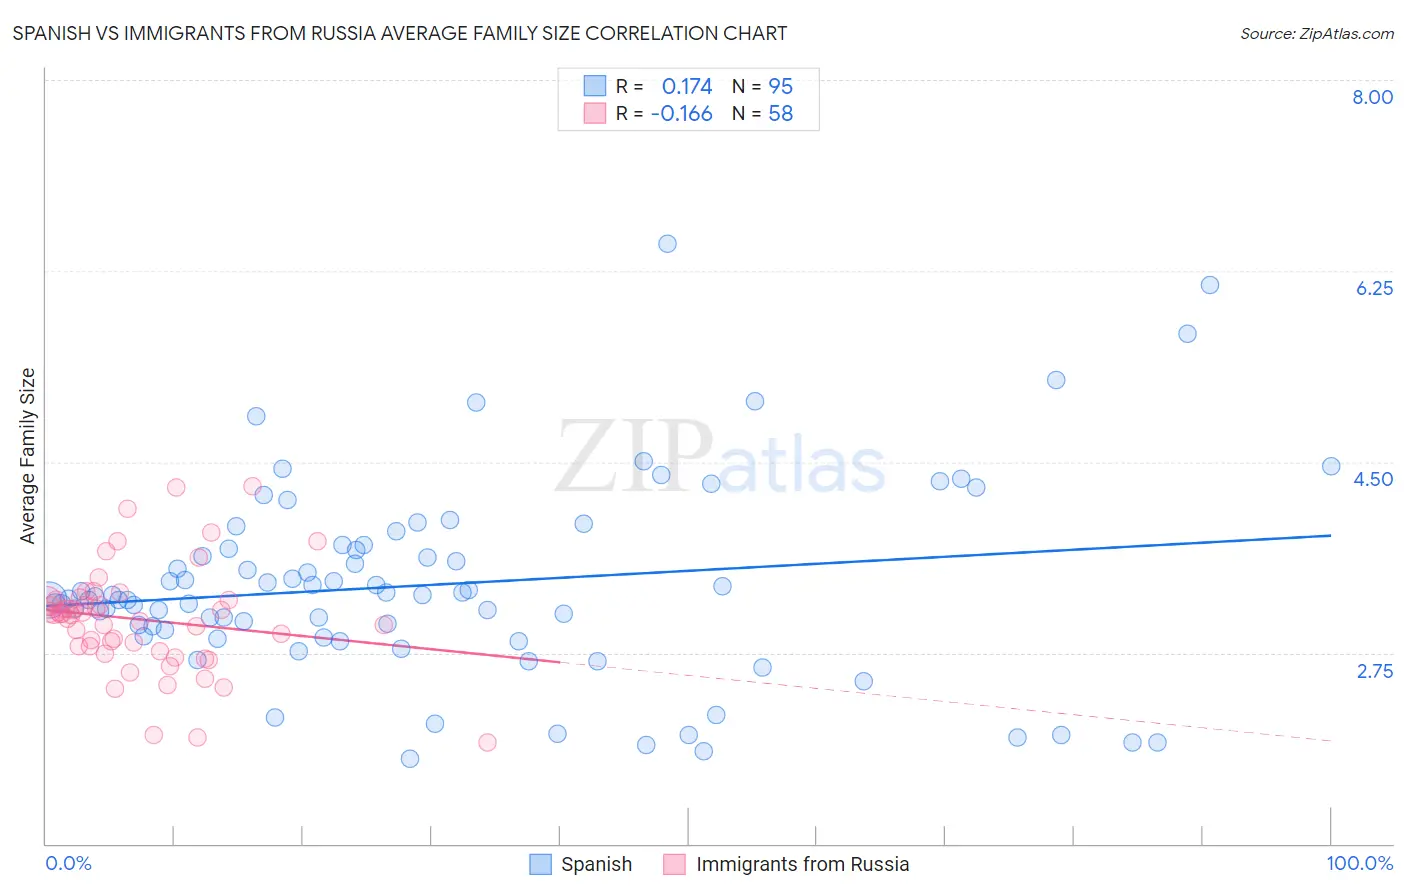
Spanish vs Immigrants from Russia Average Family Size Correlation Chart
The statistical analysis conducted on geographies consisting of 421,920,076 people shows a poor positive correlation between the proportion of Spanish and average family size in the United States with a correlation coefficient (R) of 0.174 and weighted average of 3.23. Similarly, the statistical analysis conducted on geographies consisting of 347,722,348 people shows a poor negative correlation between the proportion of Immigrants from Russia and average family size in the United States with a correlation coefficient (R) of -0.166 and weighted average of 3.16, a difference of 1.9%.
Average Family Size Correlation Summary
| Measurement | Spanish | Immigrants from Russia |
| Minimum | 1.78 | 1.93 |
| Maximum | 6.50 | 4.28 |
| Range | 4.72 | 2.35 |
| Mean | 3.37 | 3.06 |
| Median | 3.26 | 3.10 |
| Interquartile 25% (IQ1) | 2.90 | 2.81 |
| Interquartile 75% (IQ3) | 3.73 | 3.23 |
| Interquartile Range (IQR) | 0.83 | 0.42 |
| Standard Deviation (Sample) | 0.90 | 0.48 |
| Standard Deviation (Population) | 0.89 | 0.48 |
Similar Demographics by Average Family Size
Demographics Similar to Spanish by Average Family Size
In terms of average family size, the demographic groups most similar to Spanish are Moroccan (3.22, a difference of 0.010%), Palestinian (3.23, a difference of 0.030%), Spaniard (3.23, a difference of 0.040%), Immigrants from Korea (3.23, a difference of 0.040%), and Argentinean (3.23, a difference of 0.050%).
| Demographics | Rating | Rank | Average Family Size |
| Immigrants | South Central Asia | 50.0 /100 | #174 | Average 3.23 |
| Immigrants | China | 49.9 /100 | #175 | Average 3.23 |
| Israelis | 48.7 /100 | #176 | Average 3.23 |
| Argentineans | 47.4 /100 | #177 | Average 3.23 |
| Spaniards | 47.2 /100 | #178 | Average 3.23 |
| Immigrants | Korea | 46.9 /100 | #179 | Average 3.23 |
| Palestinians | 46.6 /100 | #180 | Average 3.23 |
| Spanish | 44.8 /100 | #181 | Average 3.23 |
| Moroccans | 44.2 /100 | #182 | Average 3.22 |
| Immigrants | Northern Africa | 41.7 /100 | #183 | Average 3.22 |
| Immigrants | Eastern Asia | 40.8 /100 | #184 | Average 3.22 |
| Immigrants | Sri Lanka | 39.8 /100 | #185 | Fair 3.22 |
| Immigrants | Argentina | 39.8 /100 | #186 | Fair 3.22 |
| Immigrants | Malaysia | 39.0 /100 | #187 | Fair 3.22 |
| Thais | 38.3 /100 | #188 | Fair 3.22 |
Demographics Similar to Immigrants from Russia by Average Family Size
In terms of average family size, the demographic groups most similar to Immigrants from Russia are Immigrants from Albania (3.16, a difference of 0.010%), Immigrants from North Macedonia (3.16, a difference of 0.010%), Turkish (3.16, a difference of 0.020%), Potawatomi (3.16, a difference of 0.020%), and Albanian (3.17, a difference of 0.070%).
| Demographics | Rating | Rank | Average Family Size |
| Cape Verdeans | 1.6 /100 | #255 | Tragic 3.17 |
| Immigrants | Kazakhstan | 1.5 /100 | #256 | Tragic 3.17 |
| Albanians | 1.5 /100 | #257 | Tragic 3.17 |
| Turks | 1.3 /100 | #258 | Tragic 3.16 |
| Potawatomi | 1.3 /100 | #259 | Tragic 3.16 |
| Immigrants | Albania | 1.3 /100 | #260 | Tragic 3.16 |
| Immigrants | North Macedonia | 1.3 /100 | #261 | Tragic 3.16 |
| Immigrants | Russia | 1.3 /100 | #262 | Tragic 3.16 |
| Immigrants | Bulgaria | 1.0 /100 | #263 | Tragic 3.16 |
| Americans | 1.0 /100 | #264 | Tragic 3.16 |
| Immigrants | South Africa | 0.9 /100 | #265 | Tragic 3.16 |
| Immigrants | Greece | 0.9 /100 | #266 | Tragic 3.16 |
| Iroquois | 0.8 /100 | #267 | Tragic 3.16 |
| Maltese | 0.8 /100 | #268 | Tragic 3.16 |
| Immigrants | Singapore | 0.7 /100 | #269 | Tragic 3.16 |