Yugoslavian vs Ethiopian Average Family Size
COMPARE
Yugoslavian
Ethiopian
Average Family Size
Average Family Size Comparison
Yugoslavians
Ethiopians
3.15
AVERAGE FAMILY SIZE
0.4/ 100
METRIC RATING
282nd/ 347
METRIC RANK
3.24
AVERAGE FAMILY SIZE
63.9/ 100
METRIC RATING
159th/ 347
METRIC RANK
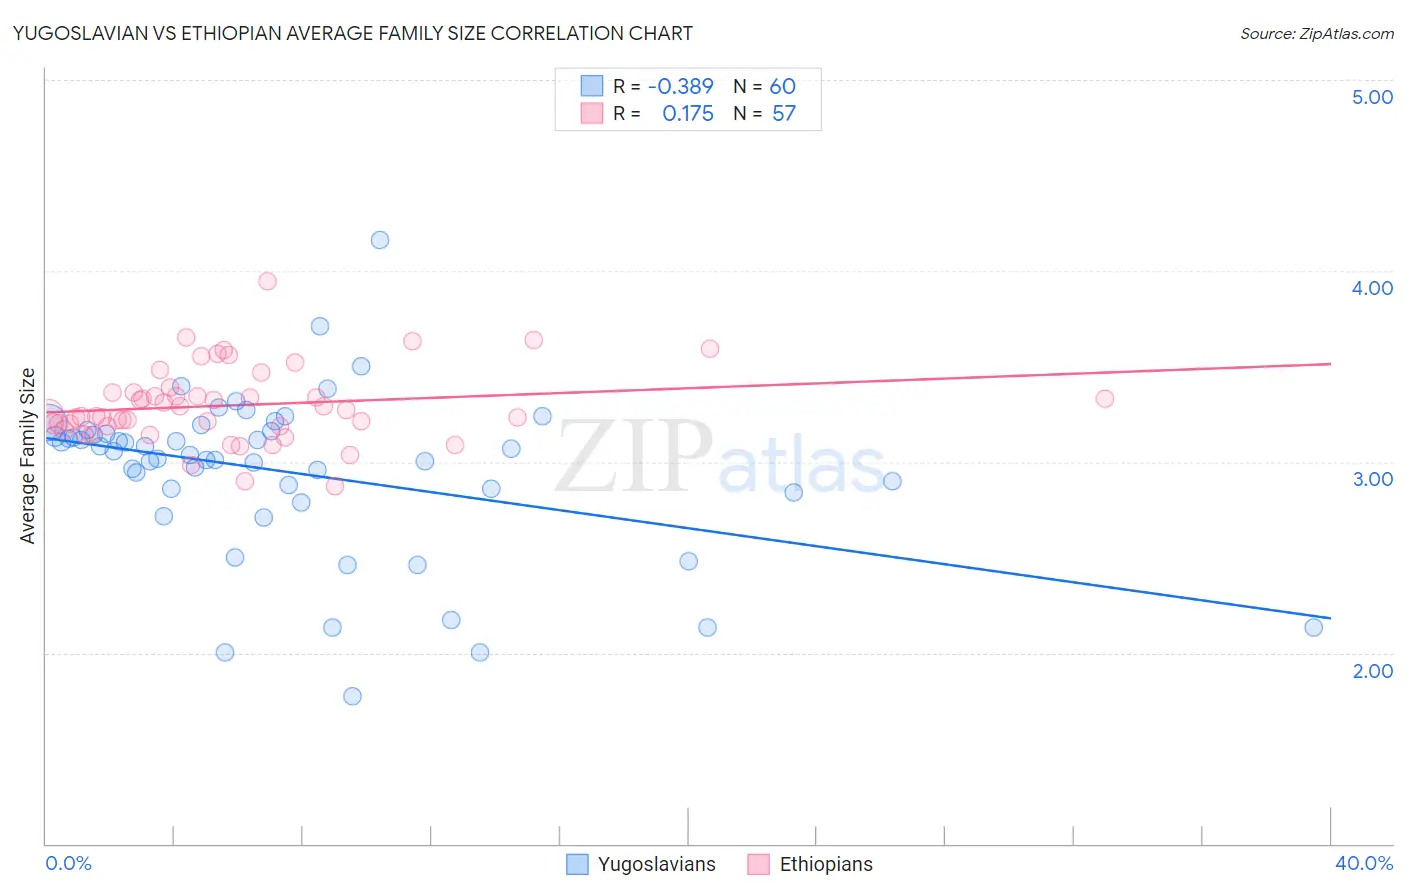
Yugoslavian vs Ethiopian Average Family Size Correlation Chart
The statistical analysis conducted on geographies consisting of 285,640,029 people shows a mild negative correlation between the proportion of Yugoslavians and average family size in the United States with a correlation coefficient (R) of -0.389 and weighted average of 3.15. Similarly, the statistical analysis conducted on geographies consisting of 223,060,111 people shows a poor positive correlation between the proportion of Ethiopians and average family size in the United States with a correlation coefficient (R) of 0.175 and weighted average of 3.24, a difference of 2.9%.
Average Family Size Correlation Summary
| Measurement | Yugoslavian | Ethiopian |
| Minimum | 1.77 | 2.87 |
| Maximum | 4.16 | 3.94 |
| Range | 2.39 | 1.07 |
| Mean | 2.95 | 3.30 |
| Median | 3.05 | 3.25 |
| Interquartile 25% (IQ1) | 2.85 | 3.19 |
| Interquartile 75% (IQ3) | 3.15 | 3.36 |
| Interquartile Range (IQR) | 0.30 | 0.18 |
| Standard Deviation (Sample) | 0.43 | 0.20 |
| Standard Deviation (Population) | 0.43 | 0.20 |
Similar Demographics by Average Family Size
Demographics Similar to Yugoslavians by Average Family Size
In terms of average family size, the demographic groups most similar to Yugoslavians are Immigrants from Denmark (3.15, a difference of 0.010%), German Russian (3.15, a difference of 0.010%), Immigrants from France (3.15, a difference of 0.030%), Immigrants from England (3.15, a difference of 0.040%), and Immigrants from Europe (3.15, a difference of 0.070%).
| Demographics | Rating | Rank | Average Family Size |
| Cambodians | 0.6 /100 | #275 | Tragic 3.15 |
| Immigrants | Bosnia and Herzegovina | 0.5 /100 | #276 | Tragic 3.15 |
| Swiss | 0.5 /100 | #277 | Tragic 3.15 |
| Okinawans | 0.5 /100 | #278 | Tragic 3.15 |
| Immigrants | Europe | 0.5 /100 | #279 | Tragic 3.15 |
| Immigrants | England | 0.4 /100 | #280 | Tragic 3.15 |
| Immigrants | Denmark | 0.4 /100 | #281 | Tragic 3.15 |
| Yugoslavians | 0.4 /100 | #282 | Tragic 3.15 |
| German Russians | 0.4 /100 | #283 | Tragic 3.15 |
| Immigrants | France | 0.4 /100 | #284 | Tragic 3.15 |
| Whites/Caucasians | 0.3 /100 | #285 | Tragic 3.14 |
| Immigrants | Netherlands | 0.3 /100 | #286 | Tragic 3.14 |
| Greeks | 0.3 /100 | #287 | Tragic 3.14 |
| Immigrants | Czechoslovakia | 0.3 /100 | #288 | Tragic 3.14 |
| Immigrants | Norway | 0.3 /100 | #289 | Tragic 3.14 |
Demographics Similar to Ethiopians by Average Family Size
In terms of average family size, the demographic groups most similar to Ethiopians are Iraqi (3.24, a difference of 0.010%), Immigrants from Iraq (3.24, a difference of 0.010%), Immigrants from Chile (3.24, a difference of 0.010%), Immigrants from Uzbekistan (3.24, a difference of 0.060%), and Immigrants from Uganda (3.23, a difference of 0.070%).
| Demographics | Rating | Rank | Average Family Size |
| Spanish Americans | 72.5 /100 | #152 | Good 3.24 |
| Immigrants | Eritrea | 71.4 /100 | #153 | Good 3.24 |
| Immigrants | Egypt | 70.0 /100 | #154 | Good 3.24 |
| Seminole | 68.2 /100 | #155 | Good 3.24 |
| Immigrants | Taiwan | 68.1 /100 | #156 | Good 3.24 |
| Immigrants | Uzbekistan | 67.0 /100 | #157 | Good 3.24 |
| Iraqis | 64.3 /100 | #158 | Good 3.24 |
| Ethiopians | 63.9 /100 | #159 | Good 3.24 |
| Immigrants | Iraq | 63.7 /100 | #160 | Good 3.24 |
| Immigrants | Chile | 63.2 /100 | #161 | Good 3.24 |
| Immigrants | Uganda | 60.1 /100 | #162 | Good 3.23 |
| Uruguayans | 58.8 /100 | #163 | Average 3.23 |
| Egyptians | 58.6 /100 | #164 | Average 3.23 |
| Ugandans | 58.4 /100 | #165 | Average 3.23 |
| Immigrants | Senegal | 57.5 /100 | #166 | Average 3.23 |