Mexican American Indian vs Immigrants from Hungary Divorced or Separated
COMPARE
Mexican American Indian
Immigrants from Hungary
Divorced or Separated
Divorced or Separated Comparison
Mexican American Indians
Immigrants from Hungary
12.0%
DIVORCED OR SEPARATED
55.8/ 100
METRIC RATING
170th/ 347
METRIC RANK
11.9%
DIVORCED OR SEPARATED
73.7/ 100
METRIC RATING
152nd/ 347
METRIC RANK
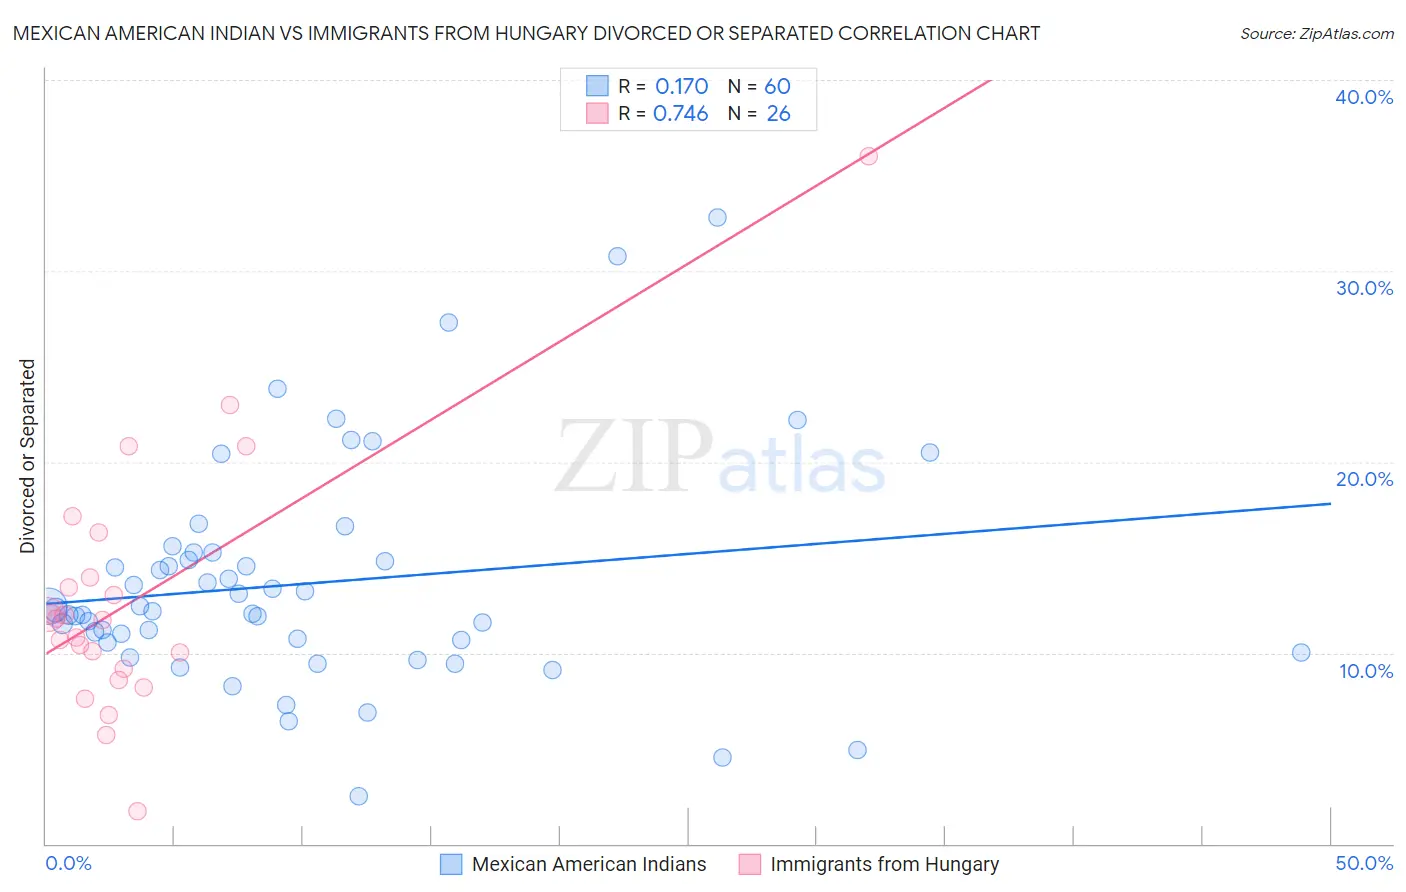
Mexican American Indian vs Immigrants from Hungary Divorced or Separated Correlation Chart
The statistical analysis conducted on geographies consisting of 317,554,193 people shows a poor positive correlation between the proportion of Mexican American Indians and percentage of population currently divorced or separated in the United States with a correlation coefficient (R) of 0.170 and weighted average of 12.0%. Similarly, the statistical analysis conducted on geographies consisting of 195,671,532 people shows a strong positive correlation between the proportion of Immigrants from Hungary and percentage of population currently divorced or separated in the United States with a correlation coefficient (R) of 0.746 and weighted average of 11.9%, a difference of 0.70%.
Divorced or Separated Correlation Summary
| Measurement | Mexican American Indian | Immigrants from Hungary |
| Minimum | 2.5% | 1.7% |
| Maximum | 32.8% | 36.0% |
| Range | 30.3% | 34.3% |
| Mean | 13.6% | 12.8% |
| Median | 12.2% | 11.8% |
| Interquartile 25% (IQ1) | 10.6% | 9.2% |
| Interquartile 75% (IQ3) | 15.0% | 13.9% |
| Interquartile Range (IQR) | 4.4% | 4.7% |
| Standard Deviation (Sample) | 5.8% | 6.7% |
| Standard Deviation (Population) | 5.8% | 6.6% |
Demographics Similar to Mexican American Indians and Immigrants from Hungary by Divorced or Separated
In terms of divorced or separated, the demographic groups most similar to Mexican American Indians are Serbian (12.0%, a difference of 0.040%), Immigrants from Peru (12.0%, a difference of 0.040%), Costa Rican (12.0%, a difference of 0.090%), Ethiopian (12.0%, a difference of 0.10%), and Tohono O'odham (12.0%, a difference of 0.16%). Similarly, the demographic groups most similar to Immigrants from Hungary are Austrian (12.0%, a difference of 0.070%), Chilean (12.0%, a difference of 0.10%), Japanese (12.0%, a difference of 0.12%), Czech (11.9%, a difference of 0.13%), and Hungarian (12.0%, a difference of 0.15%).
| Demographics | Rating | Rank | Divorced or Separated |
| Czechs | 76.4 /100 | #151 | Good 11.9% |
| Immigrants | Hungary | 73.7 /100 | #152 | Good 11.9% |
| Austrians | 72.2 /100 | #153 | Good 12.0% |
| Chileans | 71.3 /100 | #154 | Good 12.0% |
| Japanese | 70.9 /100 | #155 | Good 12.0% |
| Hungarians | 70.3 /100 | #156 | Good 12.0% |
| Immigrants | Brazil | 68.8 /100 | #157 | Good 12.0% |
| Icelanders | 66.0 /100 | #158 | Good 12.0% |
| Immigrants | Barbados | 66.0 /100 | #159 | Good 12.0% |
| Immigrants | Scotland | 65.8 /100 | #160 | Good 12.0% |
| Marshallese | 64.6 /100 | #161 | Good 12.0% |
| Samoans | 64.3 /100 | #162 | Good 12.0% |
| Navajo | 63.9 /100 | #163 | Good 12.0% |
| Swiss | 63.6 /100 | #164 | Good 12.0% |
| German Russians | 61.8 /100 | #165 | Good 12.0% |
| Tohono O'odham | 60.4 /100 | #166 | Good 12.0% |
| Ethiopians | 58.5 /100 | #167 | Average 12.0% |
| Serbians | 57.1 /100 | #168 | Average 12.0% |
| Immigrants | Peru | 57.0 /100 | #169 | Average 12.0% |
| Mexican American Indians | 55.8 /100 | #170 | Average 12.0% |
| Costa Ricans | 53.3 /100 | #171 | Average 12.0% |