Yugoslavian vs Guyanese Single Mother Households
COMPARE
Yugoslavian
Guyanese
Single Mother Households
Single Mother Households Comparison
Yugoslavians
Guyanese
6.1%
SINGLE MOTHER HOUSEHOLDS
73.1/ 100
METRIC RATING
159th/ 347
METRIC RANK
7.6%
SINGLE MOTHER HOUSEHOLDS
0.1/ 100
METRIC RATING
276th/ 347
METRIC RANK
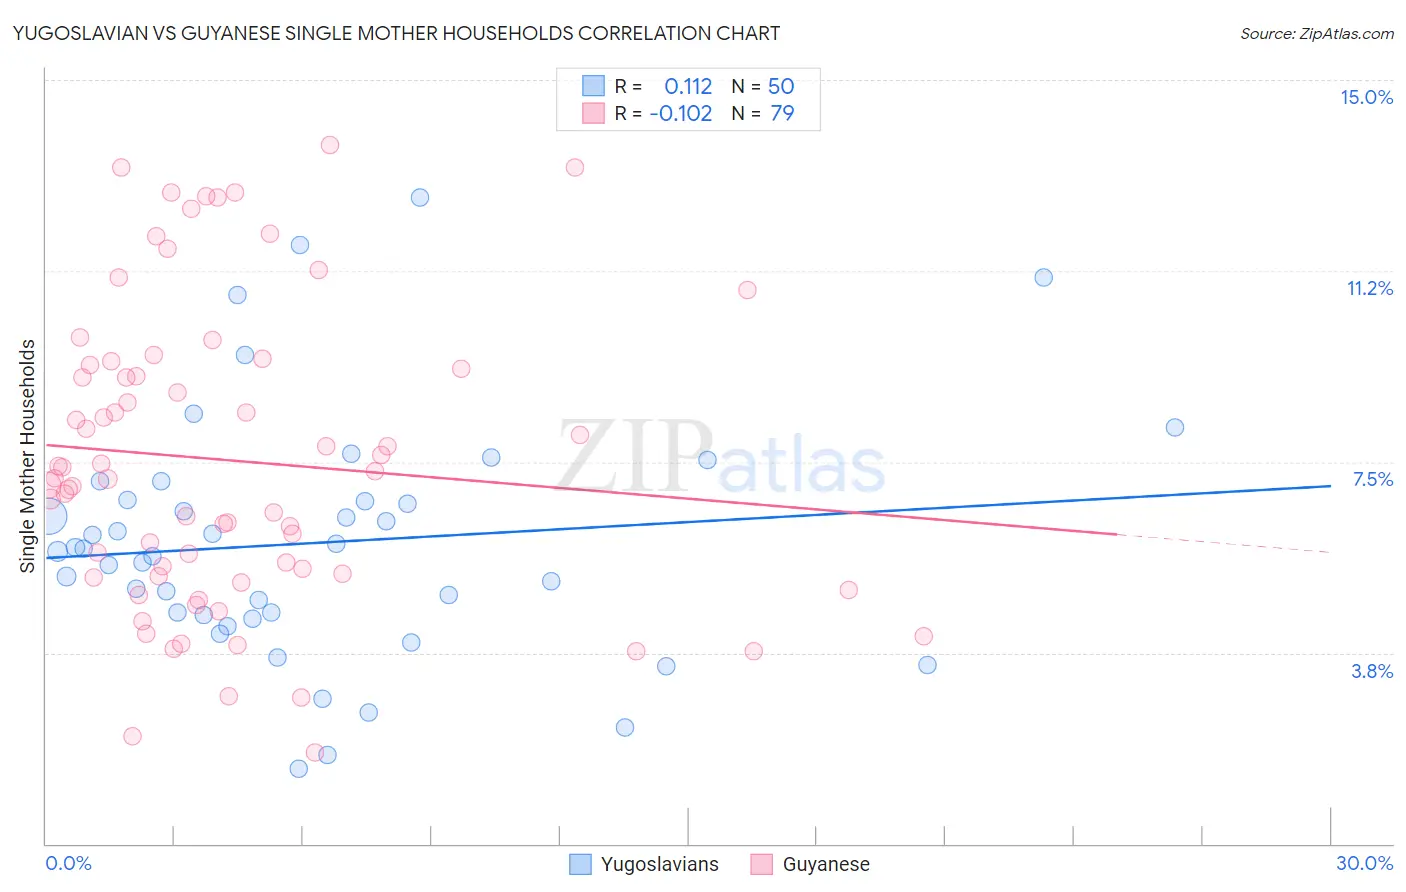
Yugoslavian vs Guyanese Single Mother Households Correlation Chart
The statistical analysis conducted on geographies consisting of 285,023,099 people shows a poor positive correlation between the proportion of Yugoslavians and percentage of single mother households in the United States with a correlation coefficient (R) of 0.112 and weighted average of 6.1%. Similarly, the statistical analysis conducted on geographies consisting of 176,625,838 people shows a poor negative correlation between the proportion of Guyanese and percentage of single mother households in the United States with a correlation coefficient (R) of -0.102 and weighted average of 7.6%, a difference of 23.8%.
Single Mother Households Correlation Summary
| Measurement | Yugoslavian | Guyanese |
| Minimum | 1.5% | 1.8% |
| Maximum | 12.7% | 13.7% |
| Range | 11.2% | 11.9% |
| Mean | 5.9% | 7.5% |
| Median | 5.8% | 7.2% |
| Interquartile 25% (IQ1) | 4.5% | 5.3% |
| Interquartile 75% (IQ3) | 6.7% | 9.4% |
| Interquartile Range (IQR) | 2.3% | 4.1% |
| Standard Deviation (Sample) | 2.4% | 2.9% |
| Standard Deviation (Population) | 2.4% | 2.9% |
Similar Demographics by Single Mother Households
Demographics Similar to Yugoslavians by Single Mother Households
In terms of single mother households, the demographic groups most similar to Yugoslavians are Iraqi (6.1%, a difference of 0.010%), Celtic (6.1%, a difference of 0.040%), Immigrants from Germany (6.1%, a difference of 0.090%), Chilean (6.1%, a difference of 0.17%), and Native Hawaiian (6.1%, a difference of 0.28%).
| Demographics | Rating | Rank | Single Mother Households |
| Pakistanis | 79.2 /100 | #152 | Good 6.1% |
| Immigrants | Brazil | 78.9 /100 | #153 | Good 6.1% |
| Immigrants | Philippines | 78.5 /100 | #154 | Good 6.1% |
| Whites/Caucasians | 76.5 /100 | #155 | Good 6.1% |
| Native Hawaiians | 75.0 /100 | #156 | Good 6.1% |
| Chileans | 74.2 /100 | #157 | Good 6.1% |
| Celtics | 73.3 /100 | #158 | Good 6.1% |
| Yugoslavians | 73.1 /100 | #159 | Good 6.1% |
| Iraqis | 73.0 /100 | #160 | Good 6.1% |
| Immigrants | Germany | 72.4 /100 | #161 | Good 6.1% |
| Immigrants | Zimbabwe | 69.9 /100 | #162 | Good 6.2% |
| Alsatians | 68.7 /100 | #163 | Good 6.2% |
| Immigrants | Northern Africa | 68.0 /100 | #164 | Good 6.2% |
| Immigrants | Syria | 67.4 /100 | #165 | Good 6.2% |
| Sri Lankans | 63.9 /100 | #166 | Good 6.2% |
Demographics Similar to Guyanese by Single Mother Households
In terms of single mother households, the demographic groups most similar to Guyanese are Immigrants from Trinidad and Tobago (7.6%, a difference of 0.040%), Central American (7.6%, a difference of 0.050%), Immigrants from El Salvador (7.6%, a difference of 0.27%), Central American Indian (7.6%, a difference of 0.45%), and Immigrants from Guyana (7.6%, a difference of 0.55%).
| Demographics | Rating | Rank | Single Mother Households |
| Somalis | 0.1 /100 | #269 | Tragic 7.5% |
| Immigrants | Cuba | 0.1 /100 | #270 | Tragic 7.5% |
| Salvadorans | 0.1 /100 | #271 | Tragic 7.5% |
| Immigrants | Azores | 0.1 /100 | #272 | Tragic 7.5% |
| Belizeans | 0.1 /100 | #273 | Tragic 7.6% |
| Immigrants | Guyana | 0.1 /100 | #274 | Tragic 7.6% |
| Central American Indians | 0.1 /100 | #275 | Tragic 7.6% |
| Guyanese | 0.1 /100 | #276 | Tragic 7.6% |
| Immigrants | Trinidad and Tobago | 0.1 /100 | #277 | Tragic 7.6% |
| Central Americans | 0.1 /100 | #278 | Tragic 7.6% |
| Immigrants | El Salvador | 0.0 /100 | #279 | Tragic 7.6% |
| Immigrants | Sierra Leone | 0.0 /100 | #280 | Tragic 7.7% |
| Immigrants | Laos | 0.0 /100 | #281 | Tragic 7.7% |
| Guatemalans | 0.0 /100 | #282 | Tragic 7.7% |
| Nigerians | 0.0 /100 | #283 | Tragic 7.7% |