Yugoslavian vs Immigrants from Dominica Single Mother Households
COMPARE
Yugoslavian
Immigrants from Dominica
Single Mother Households
Single Mother Households Comparison
Yugoslavians
Immigrants from Dominica
6.1%
SINGLE MOTHER HOUSEHOLDS
73.1/ 100
METRIC RATING
159th/ 347
METRIC RANK
8.7%
SINGLE MOTHER HOUSEHOLDS
0.0/ 100
METRIC RATING
335th/ 347
METRIC RANK
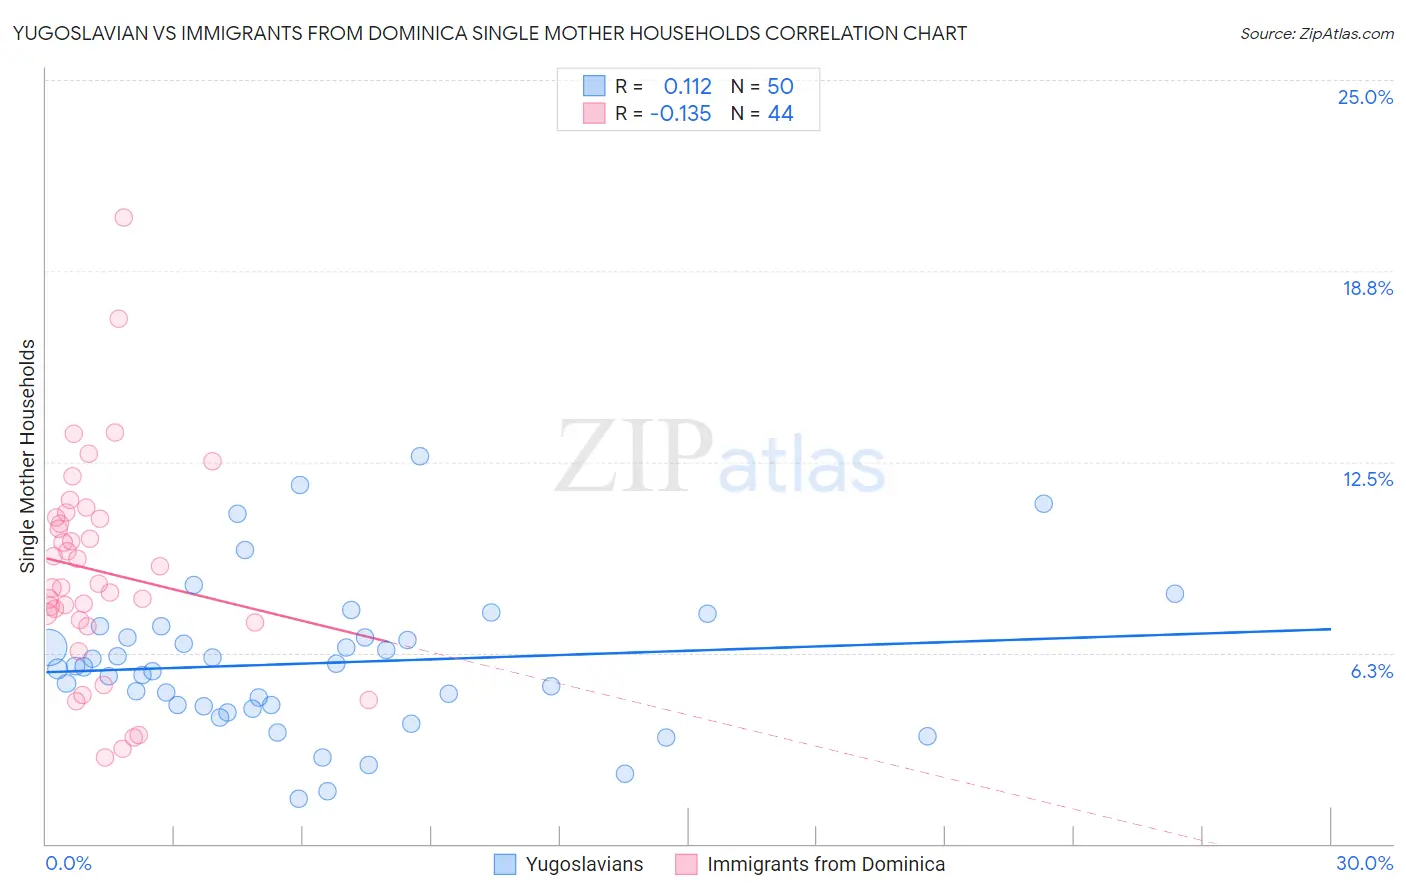
Yugoslavian vs Immigrants from Dominica Single Mother Households Correlation Chart
The statistical analysis conducted on geographies consisting of 285,023,099 people shows a poor positive correlation between the proportion of Yugoslavians and percentage of single mother households in the United States with a correlation coefficient (R) of 0.112 and weighted average of 6.1%. Similarly, the statistical analysis conducted on geographies consisting of 83,777,287 people shows a poor negative correlation between the proportion of Immigrants from Dominica and percentage of single mother households in the United States with a correlation coefficient (R) of -0.135 and weighted average of 8.7%, a difference of 42.3%.
Single Mother Households Correlation Summary
| Measurement | Yugoslavian | Immigrants from Dominica |
| Minimum | 1.5% | 2.8% |
| Maximum | 12.7% | 20.5% |
| Range | 11.2% | 17.7% |
| Mean | 5.9% | 8.9% |
| Median | 5.8% | 8.5% |
| Interquartile 25% (IQ1) | 4.5% | 7.3% |
| Interquartile 75% (IQ3) | 6.7% | 10.7% |
| Interquartile Range (IQR) | 2.3% | 3.4% |
| Standard Deviation (Sample) | 2.4% | 3.5% |
| Standard Deviation (Population) | 2.4% | 3.5% |
Similar Demographics by Single Mother Households
Demographics Similar to Yugoslavians by Single Mother Households
In terms of single mother households, the demographic groups most similar to Yugoslavians are Iraqi (6.1%, a difference of 0.010%), Celtic (6.1%, a difference of 0.040%), Immigrants from Germany (6.1%, a difference of 0.090%), Chilean (6.1%, a difference of 0.17%), and Native Hawaiian (6.1%, a difference of 0.28%).
| Demographics | Rating | Rank | Single Mother Households |
| Pakistanis | 79.2 /100 | #152 | Good 6.1% |
| Immigrants | Brazil | 78.9 /100 | #153 | Good 6.1% |
| Immigrants | Philippines | 78.5 /100 | #154 | Good 6.1% |
| Whites/Caucasians | 76.5 /100 | #155 | Good 6.1% |
| Native Hawaiians | 75.0 /100 | #156 | Good 6.1% |
| Chileans | 74.2 /100 | #157 | Good 6.1% |
| Celtics | 73.3 /100 | #158 | Good 6.1% |
| Yugoslavians | 73.1 /100 | #159 | Good 6.1% |
| Iraqis | 73.0 /100 | #160 | Good 6.1% |
| Immigrants | Germany | 72.4 /100 | #161 | Good 6.1% |
| Immigrants | Zimbabwe | 69.9 /100 | #162 | Good 6.2% |
| Alsatians | 68.7 /100 | #163 | Good 6.2% |
| Immigrants | Northern Africa | 68.0 /100 | #164 | Good 6.2% |
| Immigrants | Syria | 67.4 /100 | #165 | Good 6.2% |
| Sri Lankans | 63.9 /100 | #166 | Good 6.2% |
Demographics Similar to Immigrants from Dominica by Single Mother Households
In terms of single mother households, the demographic groups most similar to Immigrants from Dominica are Puerto Rican (8.7%, a difference of 0.040%), Immigrants from Liberia (8.7%, a difference of 0.29%), Liberian (8.6%, a difference of 1.1%), Navajo (8.8%, a difference of 1.2%), and Cape Verdean (8.9%, a difference of 1.3%).
| Demographics | Rating | Rank | Single Mother Households |
| Yakama | 0.0 /100 | #328 | Tragic 8.4% |
| Hopi | 0.0 /100 | #329 | Tragic 8.5% |
| Inupiat | 0.0 /100 | #330 | Tragic 8.5% |
| Sioux | 0.0 /100 | #331 | Tragic 8.5% |
| U.S. Virgin Islanders | 0.0 /100 | #332 | Tragic 8.6% |
| Liberians | 0.0 /100 | #333 | Tragic 8.6% |
| Immigrants | Liberia | 0.0 /100 | #334 | Tragic 8.7% |
| Immigrants | Dominica | 0.0 /100 | #335 | Tragic 8.7% |
| Puerto Ricans | 0.0 /100 | #336 | Tragic 8.7% |
| Navajo | 0.0 /100 | #337 | Tragic 8.8% |
| Cape Verdeans | 0.0 /100 | #338 | Tragic 8.9% |
| Blacks/African Americans | 0.0 /100 | #339 | Tragic 9.0% |
| Lumbee | 0.0 /100 | #340 | Tragic 9.1% |
| Tohono O'odham | 0.0 /100 | #341 | Tragic 9.1% |
| Menominee | 0.0 /100 | #342 | Tragic 9.2% |