Yugoslavian vs Immigrants from Europe Single Mother Households
COMPARE
Yugoslavian
Immigrants from Europe
Single Mother Households
Single Mother Households Comparison
Yugoslavians
Immigrants from Europe
6.1%
SINGLE MOTHER HOUSEHOLDS
73.1/ 100
METRIC RATING
159th/ 347
METRIC RANK
5.5%
SINGLE MOTHER HOUSEHOLDS
99.0/ 100
METRIC RATING
57th/ 347
METRIC RANK
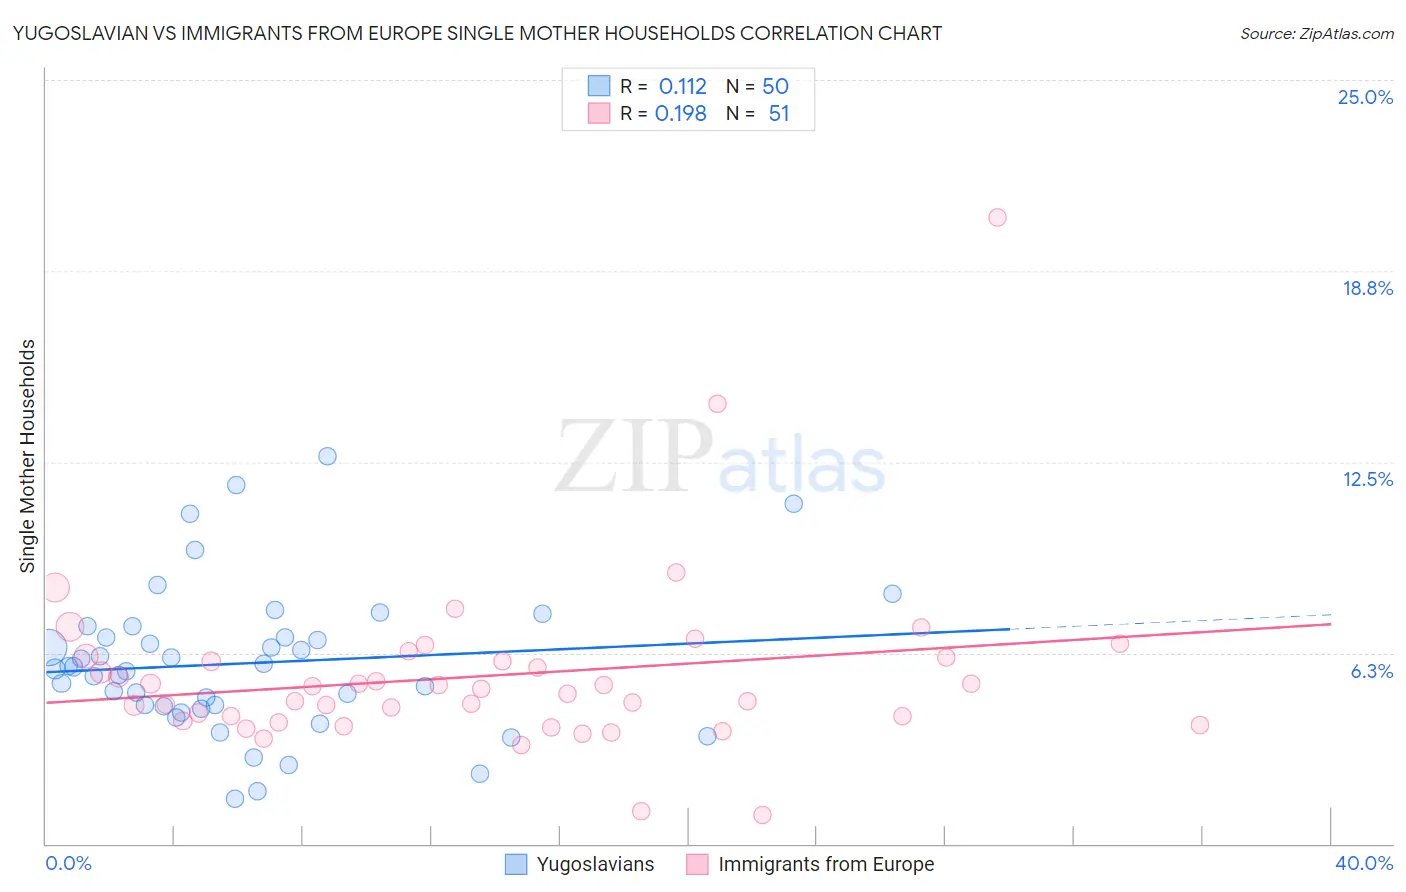
Yugoslavian vs Immigrants from Europe Single Mother Households Correlation Chart
The statistical analysis conducted on geographies consisting of 285,023,099 people shows a poor positive correlation between the proportion of Yugoslavians and percentage of single mother households in the United States with a correlation coefficient (R) of 0.112 and weighted average of 6.1%. Similarly, the statistical analysis conducted on geographies consisting of 543,439,256 people shows a poor positive correlation between the proportion of Immigrants from Europe and percentage of single mother households in the United States with a correlation coefficient (R) of 0.198 and weighted average of 5.5%, a difference of 11.3%.
Single Mother Households Correlation Summary
| Measurement | Yugoslavian | Immigrants from Europe |
| Minimum | 1.5% | 0.93% |
| Maximum | 12.7% | 20.5% |
| Range | 11.2% | 19.6% |
| Mean | 5.9% | 5.5% |
| Median | 5.8% | 5.1% |
| Interquartile 25% (IQ1) | 4.5% | 4.0% |
| Interquartile 75% (IQ3) | 6.7% | 6.1% |
| Interquartile Range (IQR) | 2.3% | 2.1% |
| Standard Deviation (Sample) | 2.4% | 2.9% |
| Standard Deviation (Population) | 2.4% | 2.9% |
Similar Demographics by Single Mother Households
Demographics Similar to Yugoslavians by Single Mother Households
In terms of single mother households, the demographic groups most similar to Yugoslavians are Iraqi (6.1%, a difference of 0.010%), Celtic (6.1%, a difference of 0.040%), Immigrants from Germany (6.1%, a difference of 0.090%), Chilean (6.1%, a difference of 0.17%), and Native Hawaiian (6.1%, a difference of 0.28%).
| Demographics | Rating | Rank | Single Mother Households |
| Pakistanis | 79.2 /100 | #152 | Good 6.1% |
| Immigrants | Brazil | 78.9 /100 | #153 | Good 6.1% |
| Immigrants | Philippines | 78.5 /100 | #154 | Good 6.1% |
| Whites/Caucasians | 76.5 /100 | #155 | Good 6.1% |
| Native Hawaiians | 75.0 /100 | #156 | Good 6.1% |
| Chileans | 74.2 /100 | #157 | Good 6.1% |
| Celtics | 73.3 /100 | #158 | Good 6.1% |
| Yugoslavians | 73.1 /100 | #159 | Good 6.1% |
| Iraqis | 73.0 /100 | #160 | Good 6.1% |
| Immigrants | Germany | 72.4 /100 | #161 | Good 6.1% |
| Immigrants | Zimbabwe | 69.9 /100 | #162 | Good 6.2% |
| Alsatians | 68.7 /100 | #163 | Good 6.2% |
| Immigrants | Northern Africa | 68.0 /100 | #164 | Good 6.2% |
| Immigrants | Syria | 67.4 /100 | #165 | Good 6.2% |
| Sri Lankans | 63.9 /100 | #166 | Good 6.2% |
Demographics Similar to Immigrants from Europe by Single Mother Households
In terms of single mother households, the demographic groups most similar to Immigrants from Europe are Immigrants from Romania (5.5%, a difference of 0.080%), Immigrants from Denmark (5.5%, a difference of 0.15%), Danish (5.5%, a difference of 0.24%), Immigrants from Lebanon (5.5%, a difference of 0.32%), and Immigrants from Russia (5.5%, a difference of 0.34%).
| Demographics | Rating | Rank | Single Mother Households |
| Immigrants | Scotland | 99.2 /100 | #50 | Exceptional 5.5% |
| Immigrants | Belarus | 99.2 /100 | #51 | Exceptional 5.5% |
| Swedes | 99.1 /100 | #52 | Exceptional 5.5% |
| Immigrants | Russia | 99.1 /100 | #53 | Exceptional 5.5% |
| Immigrants | Lebanon | 99.1 /100 | #54 | Exceptional 5.5% |
| Immigrants | Denmark | 99.1 /100 | #55 | Exceptional 5.5% |
| Immigrants | Romania | 99.0 /100 | #56 | Exceptional 5.5% |
| Immigrants | Europe | 99.0 /100 | #57 | Exceptional 5.5% |
| Danes | 98.9 /100 | #58 | Exceptional 5.5% |
| Luxembourgers | 98.7 /100 | #59 | Exceptional 5.6% |
| Immigrants | Norway | 98.7 /100 | #60 | Exceptional 5.6% |
| Australians | 98.7 /100 | #61 | Exceptional 5.6% |
| Poles | 98.6 /100 | #62 | Exceptional 5.6% |
| Immigrants | North Macedonia | 98.6 /100 | #63 | Exceptional 5.6% |
| Immigrants | France | 98.6 /100 | #64 | Exceptional 5.6% |