Yugoslavian vs Haitian Single Mother Households
COMPARE
Yugoslavian
Haitian
Single Mother Households
Single Mother Households Comparison
Yugoslavians
Haitians
6.1%
SINGLE MOTHER HOUSEHOLDS
73.1/ 100
METRIC RATING
159th/ 347
METRIC RANK
8.3%
SINGLE MOTHER HOUSEHOLDS
0.0/ 100
METRIC RATING
323rd/ 347
METRIC RANK
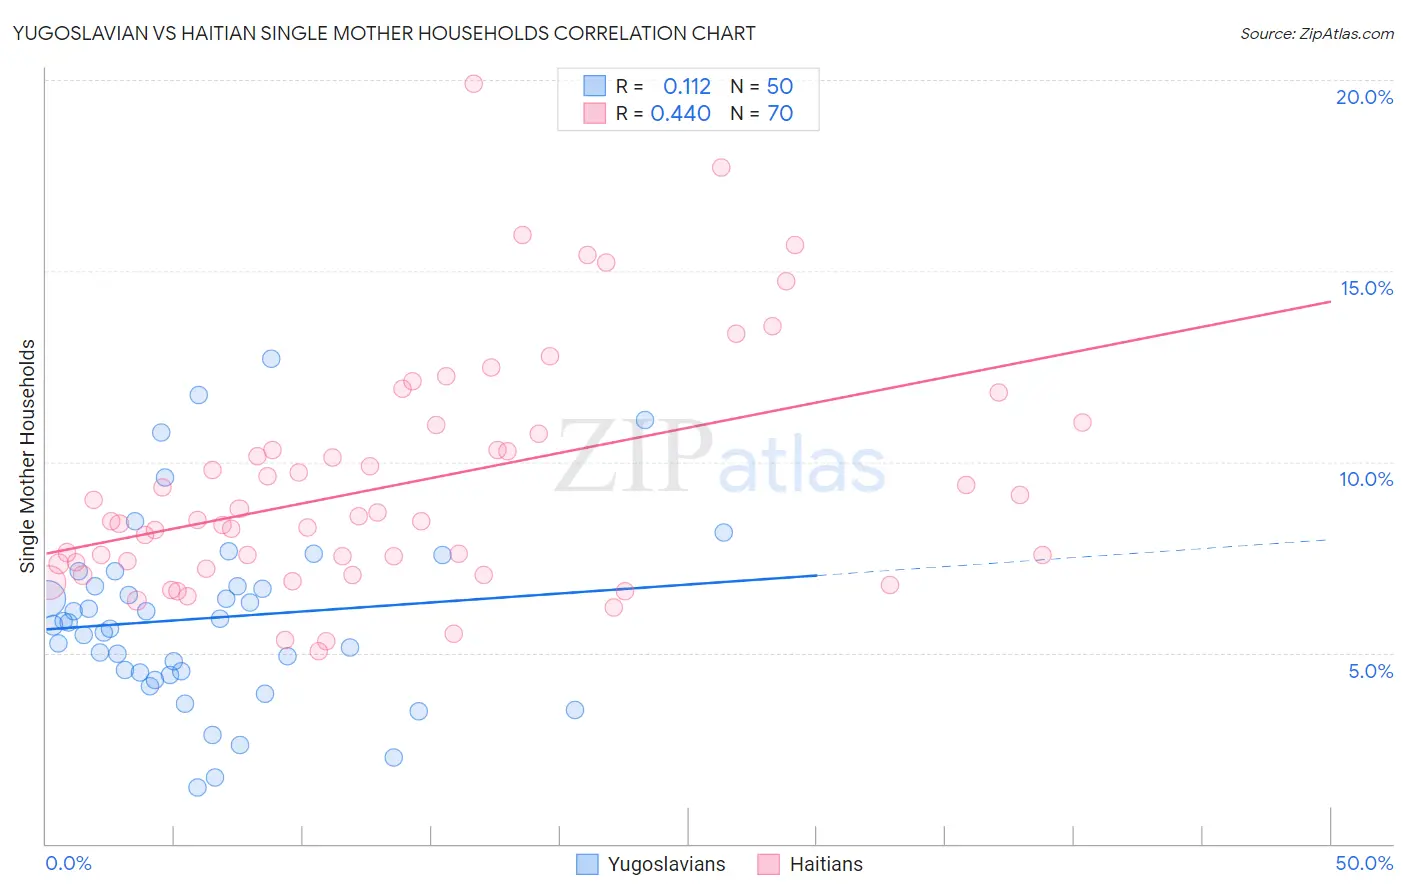
Yugoslavian vs Haitian Single Mother Households Correlation Chart
The statistical analysis conducted on geographies consisting of 285,023,099 people shows a poor positive correlation between the proportion of Yugoslavians and percentage of single mother households in the United States with a correlation coefficient (R) of 0.112 and weighted average of 6.1%. Similarly, the statistical analysis conducted on geographies consisting of 287,337,038 people shows a moderate positive correlation between the proportion of Haitians and percentage of single mother households in the United States with a correlation coefficient (R) of 0.440 and weighted average of 8.3%, a difference of 35.6%.
Single Mother Households Correlation Summary
| Measurement | Yugoslavian | Haitian |
| Minimum | 1.5% | 5.1% |
| Maximum | 12.7% | 19.9% |
| Range | 11.2% | 14.9% |
| Mean | 5.9% | 9.4% |
| Median | 5.8% | 8.5% |
| Interquartile 25% (IQ1) | 4.5% | 7.3% |
| Interquartile 75% (IQ3) | 6.7% | 10.7% |
| Interquartile Range (IQR) | 2.3% | 3.4% |
| Standard Deviation (Sample) | 2.4% | 3.1% |
| Standard Deviation (Population) | 2.4% | 3.1% |
Similar Demographics by Single Mother Households
Demographics Similar to Yugoslavians by Single Mother Households
In terms of single mother households, the demographic groups most similar to Yugoslavians are Iraqi (6.1%, a difference of 0.010%), Celtic (6.1%, a difference of 0.040%), Immigrants from Germany (6.1%, a difference of 0.090%), Chilean (6.1%, a difference of 0.17%), and Native Hawaiian (6.1%, a difference of 0.28%).
| Demographics | Rating | Rank | Single Mother Households |
| Pakistanis | 79.2 /100 | #152 | Good 6.1% |
| Immigrants | Brazil | 78.9 /100 | #153 | Good 6.1% |
| Immigrants | Philippines | 78.5 /100 | #154 | Good 6.1% |
| Whites/Caucasians | 76.5 /100 | #155 | Good 6.1% |
| Native Hawaiians | 75.0 /100 | #156 | Good 6.1% |
| Chileans | 74.2 /100 | #157 | Good 6.1% |
| Celtics | 73.3 /100 | #158 | Good 6.1% |
| Yugoslavians | 73.1 /100 | #159 | Good 6.1% |
| Iraqis | 73.0 /100 | #160 | Good 6.1% |
| Immigrants | Germany | 72.4 /100 | #161 | Good 6.1% |
| Immigrants | Zimbabwe | 69.9 /100 | #162 | Good 6.2% |
| Alsatians | 68.7 /100 | #163 | Good 6.2% |
| Immigrants | Northern Africa | 68.0 /100 | #164 | Good 6.2% |
| Immigrants | Syria | 67.4 /100 | #165 | Good 6.2% |
| Sri Lankans | 63.9 /100 | #166 | Good 6.2% |
Demographics Similar to Haitians by Single Mother Households
In terms of single mother households, the demographic groups most similar to Haitians are Immigrants from Jamaica (8.4%, a difference of 0.43%), Pima (8.3%, a difference of 0.53%), Immigrants from Senegal (8.3%, a difference of 0.61%), Immigrants from Caribbean (8.4%, a difference of 0.61%), and British West Indian (8.4%, a difference of 0.74%).
| Demographics | Rating | Rank | Single Mother Households |
| Africans | 0.0 /100 | #316 | Tragic 8.2% |
| Immigrants | Honduras | 0.0 /100 | #317 | Tragic 8.2% |
| Senegalese | 0.0 /100 | #318 | Tragic 8.2% |
| Jamaicans | 0.0 /100 | #319 | Tragic 8.2% |
| Bahamians | 0.0 /100 | #320 | Tragic 8.3% |
| Immigrants | Senegal | 0.0 /100 | #321 | Tragic 8.3% |
| Pima | 0.0 /100 | #322 | Tragic 8.3% |
| Haitians | 0.0 /100 | #323 | Tragic 8.3% |
| Immigrants | Jamaica | 0.0 /100 | #324 | Tragic 8.4% |
| Immigrants | Caribbean | 0.0 /100 | #325 | Tragic 8.4% |
| British West Indians | 0.0 /100 | #326 | Tragic 8.4% |
| Immigrants | Haiti | 0.0 /100 | #327 | Tragic 8.4% |
| Yakama | 0.0 /100 | #328 | Tragic 8.4% |
| Hopi | 0.0 /100 | #329 | Tragic 8.5% |
| Inupiat | 0.0 /100 | #330 | Tragic 8.5% |