Danish vs Immigrants from Burma/Myanmar Divorced or Separated
COMPARE
Danish
Immigrants from Burma/Myanmar
Divorced or Separated
Divorced or Separated Comparison
Danes
Immigrants from Burma/Myanmar
11.9%
DIVORCED OR SEPARATED
84.8/ 100
METRIC RATING
135th/ 347
METRIC RANK
12.1%
DIVORCED OR SEPARATED
30.4/ 100
METRIC RATING
196th/ 347
METRIC RANK
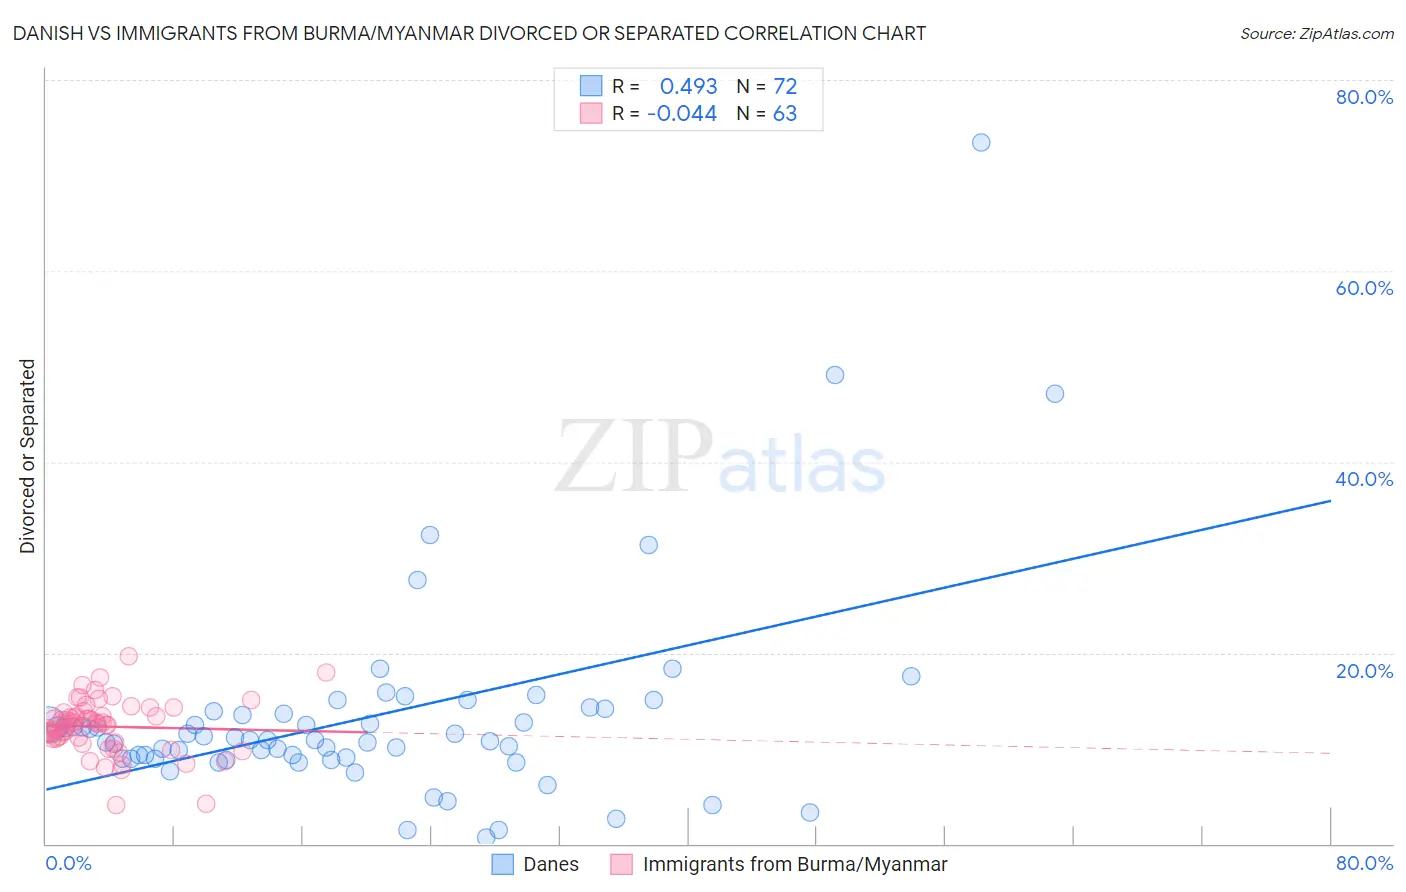
Danish vs Immigrants from Burma/Myanmar Divorced or Separated Correlation Chart
The statistical analysis conducted on geographies consisting of 473,966,187 people shows a moderate positive correlation between the proportion of Danes and percentage of population currently divorced or separated in the United States with a correlation coefficient (R) of 0.493 and weighted average of 11.9%. Similarly, the statistical analysis conducted on geographies consisting of 172,295,998 people shows no correlation between the proportion of Immigrants from Burma/Myanmar and percentage of population currently divorced or separated in the United States with a correlation coefficient (R) of -0.044 and weighted average of 12.1%, a difference of 2.2%.
Divorced or Separated Correlation Summary
| Measurement | Danish | Immigrants from Burma/Myanmar |
| Minimum | 0.70% | 4.1% |
| Maximum | 73.4% | 19.7% |
| Range | 72.7% | 15.6% |
| Mean | 13.2% | 12.3% |
| Median | 10.9% | 12.6% |
| Interquartile 25% (IQ1) | 8.9% | 11.0% |
| Interquartile 75% (IQ3) | 13.8% | 13.7% |
| Interquartile Range (IQR) | 4.8% | 2.7% |
| Standard Deviation (Sample) | 10.9% | 2.8% |
| Standard Deviation (Population) | 10.8% | 2.8% |
Similar Demographics by Divorced or Separated
Demographics Similar to Danes by Divorced or Separated
In terms of divorced or separated, the demographic groups most similar to Danes are Carpatho Rusyn (11.9%, a difference of 0.0%), Argentinean (11.9%, a difference of 0.020%), Alsatian (11.9%, a difference of 0.060%), Immigrants from Netherlands (11.9%, a difference of 0.060%), and Australian (11.9%, a difference of 0.080%).
| Demographics | Rating | Rank | Divorced or Separated |
| Immigrants | Ecuador | 88.9 /100 | #128 | Excellent 11.8% |
| Immigrants | St. Vincent and the Grenadines | 88.4 /100 | #129 | Excellent 11.8% |
| Immigrants | Austria | 88.2 /100 | #130 | Excellent 11.8% |
| Immigrants | Cambodia | 88.2 /100 | #131 | Excellent 11.8% |
| Immigrants | Afghanistan | 87.9 /100 | #132 | Excellent 11.8% |
| New Zealanders | 87.5 /100 | #133 | Excellent 11.9% |
| Argentineans | 85.1 /100 | #134 | Excellent 11.9% |
| Danes | 84.8 /100 | #135 | Excellent 11.9% |
| Carpatho Rusyns | 84.8 /100 | #136 | Excellent 11.9% |
| Alsatians | 84.0 /100 | #137 | Excellent 11.9% |
| Immigrants | Netherlands | 83.9 /100 | #138 | Excellent 11.9% |
| Australians | 83.6 /100 | #139 | Excellent 11.9% |
| Lebanese | 83.4 /100 | #140 | Excellent 11.9% |
| Immigrants | Morocco | 82.9 /100 | #141 | Excellent 11.9% |
| Immigrants | Zimbabwe | 81.5 /100 | #142 | Excellent 11.9% |
Demographics Similar to Immigrants from Burma/Myanmar by Divorced or Separated
In terms of divorced or separated, the demographic groups most similar to Immigrants from Burma/Myanmar are Immigrants from Africa (12.1%, a difference of 0.0%), Nigerian (12.1%, a difference of 0.010%), Immigrants from England (12.1%, a difference of 0.040%), Central American (12.1%, a difference of 0.040%), and Immigrants from Eritrea (12.1%, a difference of 0.060%).
| Demographics | Rating | Rank | Divorced or Separated |
| Sierra Leoneans | 35.5 /100 | #189 | Fair 12.1% |
| Moroccans | 34.8 /100 | #190 | Fair 12.1% |
| Swedes | 34.4 /100 | #191 | Fair 12.1% |
| Norwegians | 33.2 /100 | #192 | Fair 12.1% |
| Immigrants | Thailand | 32.5 /100 | #193 | Fair 12.1% |
| Immigrants | Eritrea | 31.9 /100 | #194 | Fair 12.1% |
| Immigrants | England | 31.4 /100 | #195 | Fair 12.1% |
| Immigrants | Burma/Myanmar | 30.4 /100 | #196 | Fair 12.1% |
| Immigrants | Africa | 30.3 /100 | #197 | Fair 12.1% |
| Nigerians | 30.1 /100 | #198 | Fair 12.1% |
| Central Americans | 29.4 /100 | #199 | Fair 12.1% |
| South Americans | 28.6 /100 | #200 | Fair 12.2% |
| Guatemalans | 26.9 /100 | #201 | Fair 12.2% |
| Portuguese | 23.5 /100 | #202 | Fair 12.2% |
| Immigrants | Guatemala | 23.2 /100 | #203 | Fair 12.2% |