Immigrants from Western Asia vs Immigrants from Burma/Myanmar Divorced or Separated
COMPARE
Immigrants from Western Asia
Immigrants from Burma/Myanmar
Divorced or Separated
Divorced or Separated Comparison
Immigrants from Western Asia
Immigrants from Burma/Myanmar
11.2%
DIVORCED OR SEPARATED
100.0/ 100
METRIC RATING
44th/ 347
METRIC RANK
12.1%
DIVORCED OR SEPARATED
30.4/ 100
METRIC RATING
196th/ 347
METRIC RANK
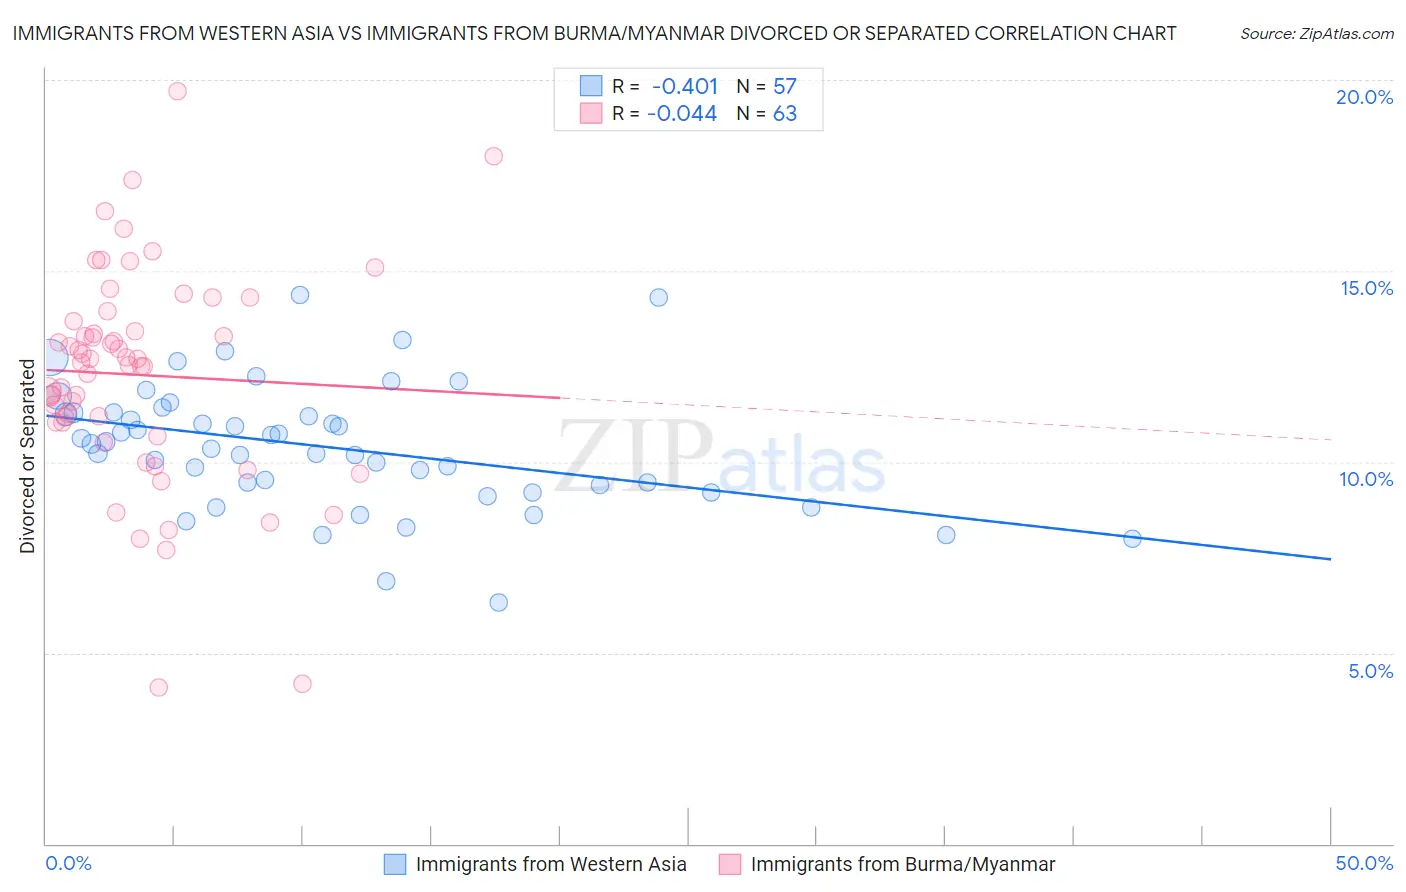
Immigrants from Western Asia vs Immigrants from Burma/Myanmar Divorced or Separated Correlation Chart
The statistical analysis conducted on geographies consisting of 404,250,440 people shows a moderate negative correlation between the proportion of Immigrants from Western Asia and percentage of population currently divorced or separated in the United States with a correlation coefficient (R) of -0.401 and weighted average of 11.2%. Similarly, the statistical analysis conducted on geographies consisting of 172,295,998 people shows no correlation between the proportion of Immigrants from Burma/Myanmar and percentage of population currently divorced or separated in the United States with a correlation coefficient (R) of -0.044 and weighted average of 12.1%, a difference of 8.5%.
Divorced or Separated Correlation Summary
| Measurement | Immigrants from Western Asia | Immigrants from Burma/Myanmar |
| Minimum | 6.3% | 4.1% |
| Maximum | 14.4% | 19.7% |
| Range | 8.1% | 15.6% |
| Mean | 10.4% | 12.3% |
| Median | 10.5% | 12.6% |
| Interquartile 25% (IQ1) | 9.3% | 11.0% |
| Interquartile 75% (IQ3) | 11.3% | 13.7% |
| Interquartile Range (IQR) | 2.0% | 2.7% |
| Standard Deviation (Sample) | 1.6% | 2.8% |
| Standard Deviation (Population) | 1.6% | 2.8% |
Similar Demographics by Divorced or Separated
Demographics Similar to Immigrants from Western Asia by Divorced or Separated
In terms of divorced or separated, the demographic groups most similar to Immigrants from Western Asia are Immigrants from Belarus (11.2%, a difference of 0.010%), Chinese (11.2%, a difference of 0.020%), Turkish (11.2%, a difference of 0.050%), Bhutanese (11.2%, a difference of 0.090%), and Laotian (11.2%, a difference of 0.16%).
| Demographics | Rating | Rank | Divorced or Separated |
| Immigrants | Lebanon | 100.0 /100 | #37 | Exceptional 11.1% |
| Immigrants | Greece | 100.0 /100 | #38 | Exceptional 11.1% |
| Immigrants | Egypt | 100.0 /100 | #39 | Exceptional 11.1% |
| Soviet Union | 100.0 /100 | #40 | Exceptional 11.1% |
| Bhutanese | 100.0 /100 | #41 | Exceptional 11.2% |
| Chinese | 100.0 /100 | #42 | Exceptional 11.2% |
| Immigrants | Belarus | 100.0 /100 | #43 | Exceptional 11.2% |
| Immigrants | Western Asia | 100.0 /100 | #44 | Exceptional 11.2% |
| Turks | 100.0 /100 | #45 | Exceptional 11.2% |
| Laotians | 100.0 /100 | #46 | Exceptional 11.2% |
| Immigrants | Poland | 100.0 /100 | #47 | Exceptional 11.2% |
| Immigrants | Turkey | 100.0 /100 | #48 | Exceptional 11.2% |
| Immigrants | Saudi Arabia | 100.0 /100 | #49 | Exceptional 11.2% |
| Bolivians | 100.0 /100 | #50 | Exceptional 11.2% |
| Immigrants | Bolivia | 100.0 /100 | #51 | Exceptional 11.3% |
Demographics Similar to Immigrants from Burma/Myanmar by Divorced or Separated
In terms of divorced or separated, the demographic groups most similar to Immigrants from Burma/Myanmar are Immigrants from Africa (12.1%, a difference of 0.0%), Nigerian (12.1%, a difference of 0.010%), Immigrants from England (12.1%, a difference of 0.040%), Central American (12.1%, a difference of 0.040%), and Immigrants from Eritrea (12.1%, a difference of 0.060%).
| Demographics | Rating | Rank | Divorced or Separated |
| Sierra Leoneans | 35.5 /100 | #189 | Fair 12.1% |
| Moroccans | 34.8 /100 | #190 | Fair 12.1% |
| Swedes | 34.4 /100 | #191 | Fair 12.1% |
| Norwegians | 33.2 /100 | #192 | Fair 12.1% |
| Immigrants | Thailand | 32.5 /100 | #193 | Fair 12.1% |
| Immigrants | Eritrea | 31.9 /100 | #194 | Fair 12.1% |
| Immigrants | England | 31.4 /100 | #195 | Fair 12.1% |
| Immigrants | Burma/Myanmar | 30.4 /100 | #196 | Fair 12.1% |
| Immigrants | Africa | 30.3 /100 | #197 | Fair 12.1% |
| Nigerians | 30.1 /100 | #198 | Fair 12.1% |
| Central Americans | 29.4 /100 | #199 | Fair 12.1% |
| South Americans | 28.6 /100 | #200 | Fair 12.2% |
| Guatemalans | 26.9 /100 | #201 | Fair 12.2% |
| Portuguese | 23.5 /100 | #202 | Fair 12.2% |
| Immigrants | Guatemala | 23.2 /100 | #203 | Fair 12.2% |