Yaqui vs Immigrants from Albania Family Households
COMPARE
Yaqui
Immigrants from Albania
Family Households
Family Households Comparison
Yaqui
Immigrants from Albania
65.6%
FAMILY HOUSEHOLDS
99.8/ 100
METRIC RATING
78th/ 347
METRIC RANK
62.4%
FAMILY HOUSEHOLDS
0.0/ 100
METRIC RATING
301st/ 347
METRIC RANK
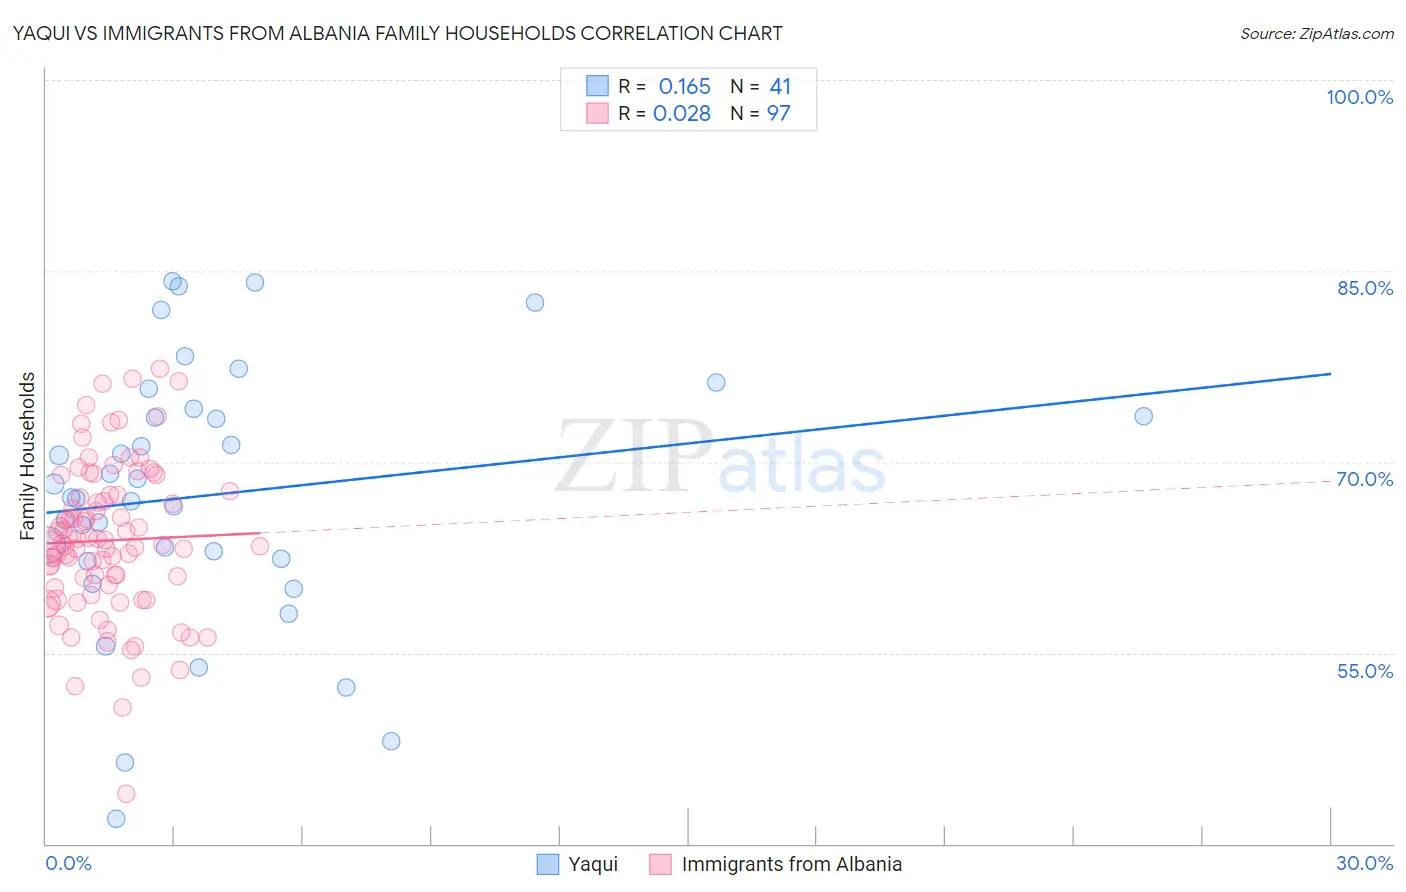
Yaqui vs Immigrants from Albania Family Households Correlation Chart
The statistical analysis conducted on geographies consisting of 107,720,236 people shows a poor positive correlation between the proportion of Yaqui and percentage of family households in the United States with a correlation coefficient (R) of 0.165 and weighted average of 65.6%. Similarly, the statistical analysis conducted on geographies consisting of 119,383,299 people shows no correlation between the proportion of Immigrants from Albania and percentage of family households in the United States with a correlation coefficient (R) of 0.028 and weighted average of 62.4%, a difference of 5.2%.
Family Households Correlation Summary
| Measurement | Yaqui | Immigrants from Albania |
| Minimum | 41.9% | 44.0% |
| Maximum | 84.2% | 77.4% |
| Range | 42.3% | 33.4% |
| Mean | 67.4% | 63.8% |
| Median | 67.2% | 63.6% |
| Interquartile 25% (IQ1) | 62.3% | 60.2% |
| Interquartile 75% (IQ3) | 73.9% | 67.4% |
| Interquartile Range (IQR) | 11.6% | 7.2% |
| Standard Deviation (Sample) | 10.2% | 6.0% |
| Standard Deviation (Population) | 10.1% | 6.0% |
Similar Demographics by Family Households
Demographics Similar to Yaqui by Family Households
In terms of family households, the demographic groups most similar to Yaqui are Immigrants from South America (65.6%, a difference of 0.0%), Immigrants from the Azores (65.6%, a difference of 0.010%), Immigrants from Costa Rica (65.6%, a difference of 0.030%), Puget Sound Salish (65.6%, a difference of 0.050%), and Houma (65.7%, a difference of 0.12%).
| Demographics | Rating | Rank | Family Households |
| Bhutanese | 99.9 /100 | #71 | Exceptional 65.9% |
| Portuguese | 99.9 /100 | #72 | Exceptional 65.8% |
| Laotians | 99.9 /100 | #73 | Exceptional 65.8% |
| Burmese | 99.9 /100 | #74 | Exceptional 65.7% |
| Houma | 99.9 /100 | #75 | Exceptional 65.7% |
| Immigrants | Azores | 99.8 /100 | #76 | Exceptional 65.6% |
| Immigrants | South America | 99.8 /100 | #77 | Exceptional 65.6% |
| Yaqui | 99.8 /100 | #78 | Exceptional 65.6% |
| Immigrants | Costa Rica | 99.8 /100 | #79 | Exceptional 65.6% |
| Puget Sound Salish | 99.8 /100 | #80 | Exceptional 65.6% |
| Jordanians | 99.7 /100 | #81 | Exceptional 65.5% |
| Immigrants | Lebanon | 99.7 /100 | #82 | Exceptional 65.5% |
| Immigrants | Guyana | 99.6 /100 | #83 | Exceptional 65.5% |
| Americans | 99.6 /100 | #84 | Exceptional 65.5% |
| Immigrants | Cambodia | 99.5 /100 | #85 | Exceptional 65.4% |
Demographics Similar to Immigrants from Albania by Family Households
In terms of family households, the demographic groups most similar to Immigrants from Albania are Immigrants from Africa (62.4%, a difference of 0.020%), Immigrants from Kuwait (62.4%, a difference of 0.030%), Immigrants from Kenya (62.3%, a difference of 0.040%), Immigrants from Spain (62.4%, a difference of 0.090%), and Cree (62.3%, a difference of 0.10%).
| Demographics | Rating | Rank | Family Households |
| Barbadians | 0.0 /100 | #294 | Tragic 62.5% |
| Okinawans | 0.0 /100 | #295 | Tragic 62.5% |
| Slovenes | 0.0 /100 | #296 | Tragic 62.4% |
| French American Indians | 0.0 /100 | #297 | Tragic 62.4% |
| Immigrants | Spain | 0.0 /100 | #298 | Tragic 62.4% |
| Immigrants | Kuwait | 0.0 /100 | #299 | Tragic 62.4% |
| Immigrants | Africa | 0.0 /100 | #300 | Tragic 62.4% |
| Immigrants | Albania | 0.0 /100 | #301 | Tragic 62.4% |
| Immigrants | Kenya | 0.0 /100 | #302 | Tragic 62.3% |
| Cree | 0.0 /100 | #303 | Tragic 62.3% |
| Iroquois | 0.0 /100 | #304 | Tragic 62.2% |
| Bermudans | 0.0 /100 | #305 | Tragic 62.2% |
| Africans | 0.0 /100 | #306 | Tragic 62.1% |
| Immigrants | Norway | 0.0 /100 | #307 | Tragic 62.1% |
| Chippewa | 0.0 /100 | #308 | Tragic 62.1% |