Yakama vs Macedonian 9th Grade
COMPARE
Yakama
Macedonian
9th Grade
9th Grade Comparison
Yakama
Macedonians
90.1%
9TH GRADE
0.0/ 100
METRIC RATING
339th/ 347
METRIC RANK
96.0%
9TH GRADE
99.8/ 100
METRIC RATING
57th/ 347
METRIC RANK
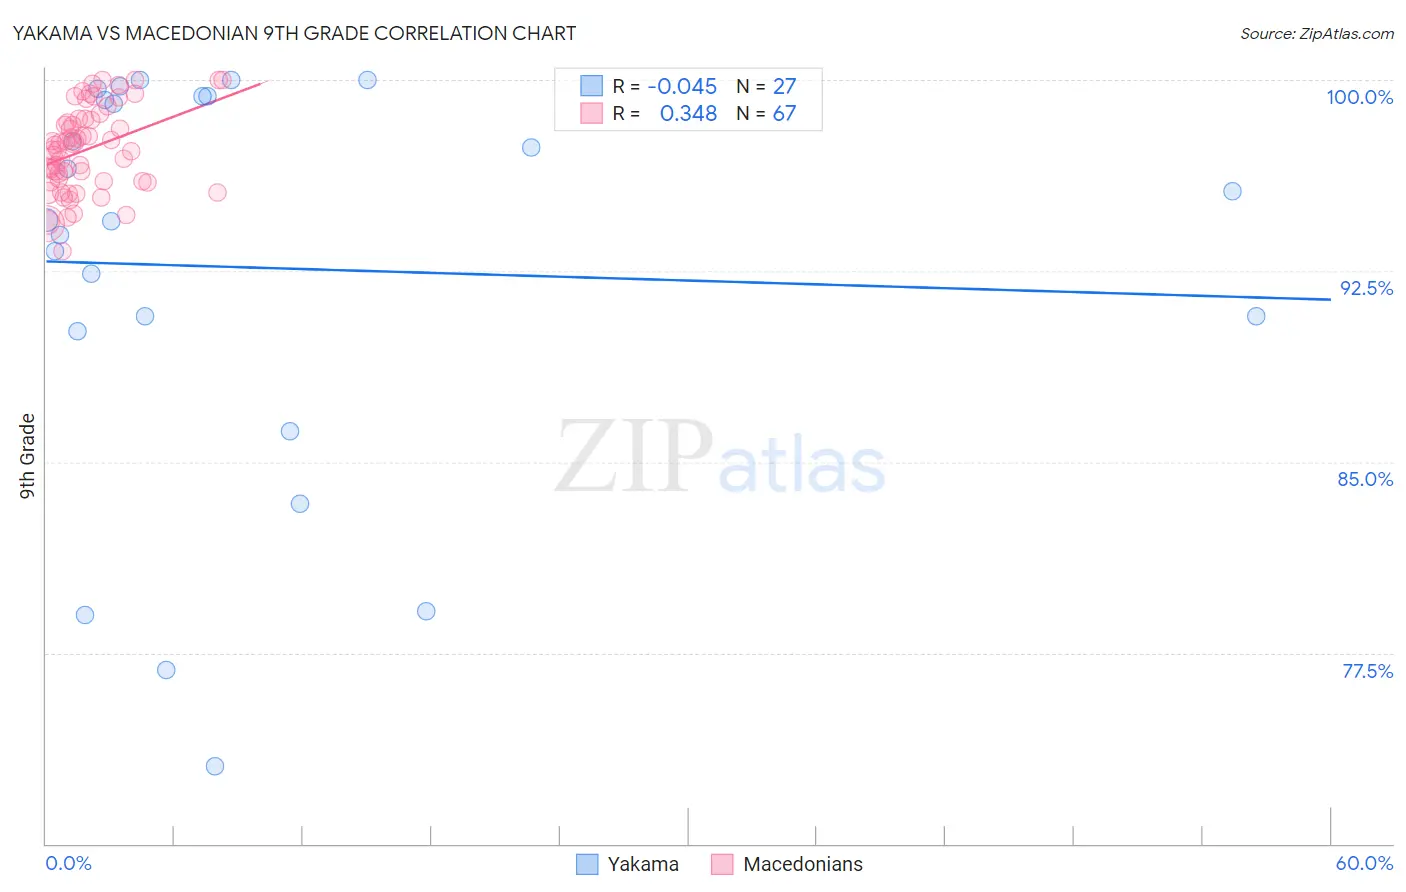
Yakama vs Macedonian 9th Grade Correlation Chart
The statistical analysis conducted on geographies consisting of 19,923,144 people shows no correlation between the proportion of Yakama and percentage of population with at least 9th grade education in the United States with a correlation coefficient (R) of -0.045 and weighted average of 90.1%. Similarly, the statistical analysis conducted on geographies consisting of 132,581,663 people shows a mild positive correlation between the proportion of Macedonians and percentage of population with at least 9th grade education in the United States with a correlation coefficient (R) of 0.348 and weighted average of 96.0%, a difference of 6.6%.
9th Grade Correlation Summary
| Measurement | Yakama | Macedonian |
| Minimum | 73.0% | 93.3% |
| Maximum | 100.0% | 100.0% |
| Range | 27.0% | 6.7% |
| Mean | 92.6% | 97.3% |
| Median | 94.5% | 97.5% |
| Interquartile 25% (IQ1) | 90.1% | 96.0% |
| Interquartile 75% (IQ3) | 99.3% | 98.5% |
| Interquartile Range (IQR) | 9.2% | 2.5% |
| Standard Deviation (Sample) | 8.0% | 1.7% |
| Standard Deviation (Population) | 7.8% | 1.6% |
Similar Demographics by 9th Grade
Demographics Similar to Yakama by 9th Grade
In terms of 9th grade, the demographic groups most similar to Yakama are Mexican (90.0%, a difference of 0.060%), Guatemalan (89.9%, a difference of 0.19%), Central American (90.4%, a difference of 0.34%), Immigrants from Latin America (90.4%, a difference of 0.35%), and Immigrants from Dominican Republic (90.5%, a difference of 0.47%).
| Demographics | Rating | Rank | 9th Grade |
| Hispanics or Latinos | 0.0 /100 | #332 | Tragic 90.9% |
| Immigrants | Yemen | 0.0 /100 | #333 | Tragic 90.8% |
| Immigrants | Azores | 0.0 /100 | #334 | Tragic 90.8% |
| Immigrants | Honduras | 0.0 /100 | #335 | Tragic 90.6% |
| Immigrants | Dominican Republic | 0.0 /100 | #336 | Tragic 90.5% |
| Immigrants | Latin America | 0.0 /100 | #337 | Tragic 90.4% |
| Central Americans | 0.0 /100 | #338 | Tragic 90.4% |
| Yakama | 0.0 /100 | #339 | Tragic 90.1% |
| Mexicans | 0.0 /100 | #340 | Tragic 90.0% |
| Guatemalans | 0.0 /100 | #341 | Tragic 89.9% |
| Salvadorans | 0.0 /100 | #342 | Tragic 89.6% |
| Immigrants | Guatemala | 0.0 /100 | #343 | Tragic 89.4% |
| Immigrants | El Salvador | 0.0 /100 | #344 | Tragic 89.0% |
| Immigrants | Central America | 0.0 /100 | #345 | Tragic 89.0% |
| Immigrants | Mexico | 0.0 /100 | #346 | Tragic 88.7% |
Demographics Similar to Macedonians by 9th Grade
In terms of 9th grade, the demographic groups most similar to Macedonians are Aleut (96.0%, a difference of 0.0%), Immigrants from Austria (96.0%, a difference of 0.010%), Immigrants from North America (96.0%, a difference of 0.010%), New Zealander (95.9%, a difference of 0.020%), and Immigrants from Canada (96.0%, a difference of 0.030%).
| Demographics | Rating | Rank | 9th Grade |
| Celtics | 99.9 /100 | #50 | Exceptional 96.0% |
| Immigrants | Northern Europe | 99.9 /100 | #51 | Exceptional 96.0% |
| Serbians | 99.9 /100 | #52 | Exceptional 96.0% |
| Austrians | 99.8 /100 | #53 | Exceptional 96.0% |
| Immigrants | Canada | 99.8 /100 | #54 | Exceptional 96.0% |
| Immigrants | Austria | 99.8 /100 | #55 | Exceptional 96.0% |
| Immigrants | North America | 99.8 /100 | #56 | Exceptional 96.0% |
| Macedonians | 99.8 /100 | #57 | Exceptional 96.0% |
| Aleuts | 99.8 /100 | #58 | Exceptional 96.0% |
| New Zealanders | 99.8 /100 | #59 | Exceptional 95.9% |
| Native Hawaiians | 99.8 /100 | #60 | Exceptional 95.9% |
| Sioux | 99.8 /100 | #61 | Exceptional 95.9% |
| Ukrainians | 99.7 /100 | #62 | Exceptional 95.9% |
| Canadians | 99.7 /100 | #63 | Exceptional 95.9% |
| Zimbabweans | 99.7 /100 | #64 | Exceptional 95.9% |