Guyanese vs Shoshone Births to Unmarried Women
COMPARE
Guyanese
Shoshone
Births to Unmarried Women
Births to Unmarried Women Comparison
Guyanese
Shoshone
35.2%
BIRTHS TO UNMARRIED WOMEN
0.9/ 100
METRIC RATING
244th/ 347
METRIC RANK
35.3%
BIRTHS TO UNMARRIED WOMEN
0.8/ 100
METRIC RATING
245th/ 347
METRIC RANK
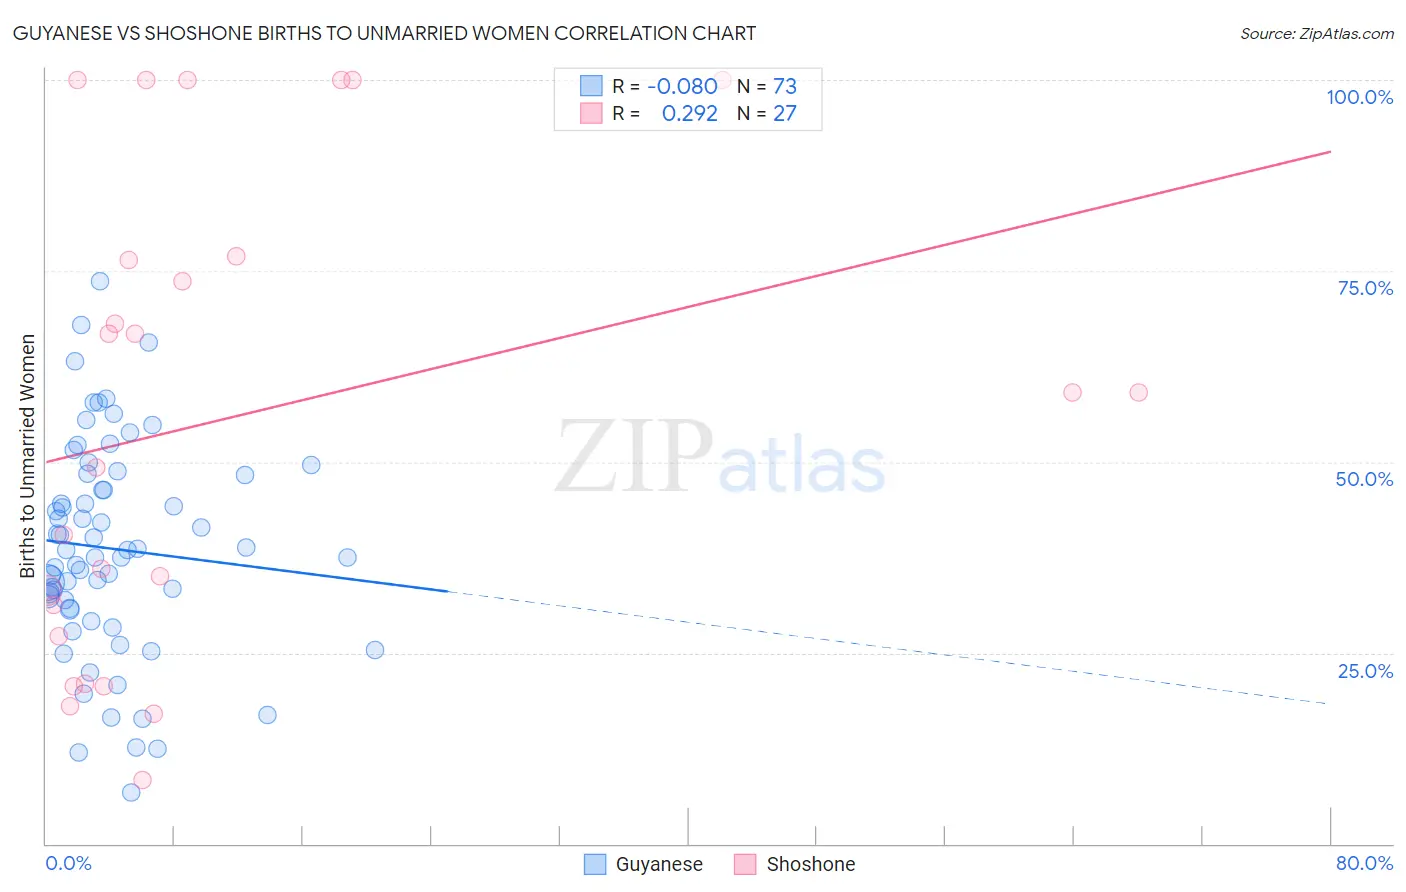
Guyanese vs Shoshone Births to Unmarried Women Correlation Chart
The statistical analysis conducted on geographies consisting of 170,903,529 people shows a slight negative correlation between the proportion of Guyanese and percentage of births to unmarried women in the United States with a correlation coefficient (R) of -0.080 and weighted average of 35.2%. Similarly, the statistical analysis conducted on geographies consisting of 65,659,709 people shows a weak positive correlation between the proportion of Shoshone and percentage of births to unmarried women in the United States with a correlation coefficient (R) of 0.292 and weighted average of 35.3%, a difference of 0.34%.
Births to Unmarried Women Correlation Summary
| Measurement | Guyanese | Shoshone |
| Minimum | 6.7% | 8.3% |
| Maximum | 73.7% | 100.0% |
| Range | 67.0% | 91.7% |
| Mean | 38.6% | 55.7% |
| Median | 38.4% | 59.1% |
| Interquartile 25% (IQ1) | 30.7% | 27.2% |
| Interquartile 75% (IQ3) | 48.3% | 76.9% |
| Interquartile Range (IQR) | 17.6% | 49.7% |
| Standard Deviation (Sample) | 13.9% | 31.1% |
| Standard Deviation (Population) | 13.8% | 30.6% |
Demographics Similar to Guyanese and Shoshone by Births to Unmarried Women
In terms of births to unmarried women, the demographic groups most similar to Guyanese are Japanese (35.2%, a difference of 0.060%), Nigerian (35.3%, a difference of 0.45%), Indonesian (35.0%, a difference of 0.55%), Immigrants from Guyana (35.0%, a difference of 0.65%), and Immigrants from Nigeria (35.4%, a difference of 0.66%). Similarly, the demographic groups most similar to Shoshone are Nigerian (35.3%, a difference of 0.11%), Immigrants from Nigeria (35.4%, a difference of 0.32%), Japanese (35.2%, a difference of 0.40%), Nonimmigrants (35.5%, a difference of 0.65%), and Bermudan (35.5%, a difference of 0.66%).
| Demographics | Rating | Rank | Births to Unmarried Women |
| Immigrants | Zaire | 2.3 /100 | #234 | Tragic 34.5% |
| Immigrants | Ghana | 2.2 /100 | #235 | Tragic 34.5% |
| Immigrants | Cameroon | 1.6 /100 | #236 | Tragic 34.7% |
| Marshallese | 1.6 /100 | #237 | Tragic 34.8% |
| Immigrants | Cambodia | 1.6 /100 | #238 | Tragic 34.8% |
| Sierra Leoneans | 1.4 /100 | #239 | Tragic 34.9% |
| Immigrants | Middle Africa | 1.2 /100 | #240 | Tragic 34.9% |
| Immigrants | Guyana | 1.2 /100 | #241 | Tragic 35.0% |
| Indonesians | 1.2 /100 | #242 | Tragic 35.0% |
| Japanese | 0.9 /100 | #243 | Tragic 35.2% |
| Guyanese | 0.9 /100 | #244 | Tragic 35.2% |
| Shoshone | 0.8 /100 | #245 | Tragic 35.3% |
| Nigerians | 0.7 /100 | #246 | Tragic 35.3% |
| Immigrants | Nigeria | 0.7 /100 | #247 | Tragic 35.4% |
| Immigrants | Nonimmigrants | 0.6 /100 | #248 | Tragic 35.5% |
| Bermudans | 0.6 /100 | #249 | Tragic 35.5% |
| Mexican American Indians | 0.4 /100 | #250 | Tragic 35.7% |
| Immigrants | Western Africa | 0.3 /100 | #251 | Tragic 36.0% |
| Salvadorans | 0.3 /100 | #252 | Tragic 36.0% |
| Immigrants | Portugal | 0.2 /100 | #253 | Tragic 36.2% |
| Potawatomi | 0.2 /100 | #254 | Tragic 36.2% |