Costa Rican vs Native Hawaiian Average Family Size
COMPARE
Costa Rican
Native Hawaiian
Average Family Size
Average Family Size Comparison
Costa Ricans
Native Hawaiians
3.26
AVERAGE FAMILY SIZE
86.8/ 100
METRIC RATING
132nd/ 347
METRIC RANK
3.43
AVERAGE FAMILY SIZE
100.0/ 100
METRIC RATING
26th/ 347
METRIC RANK
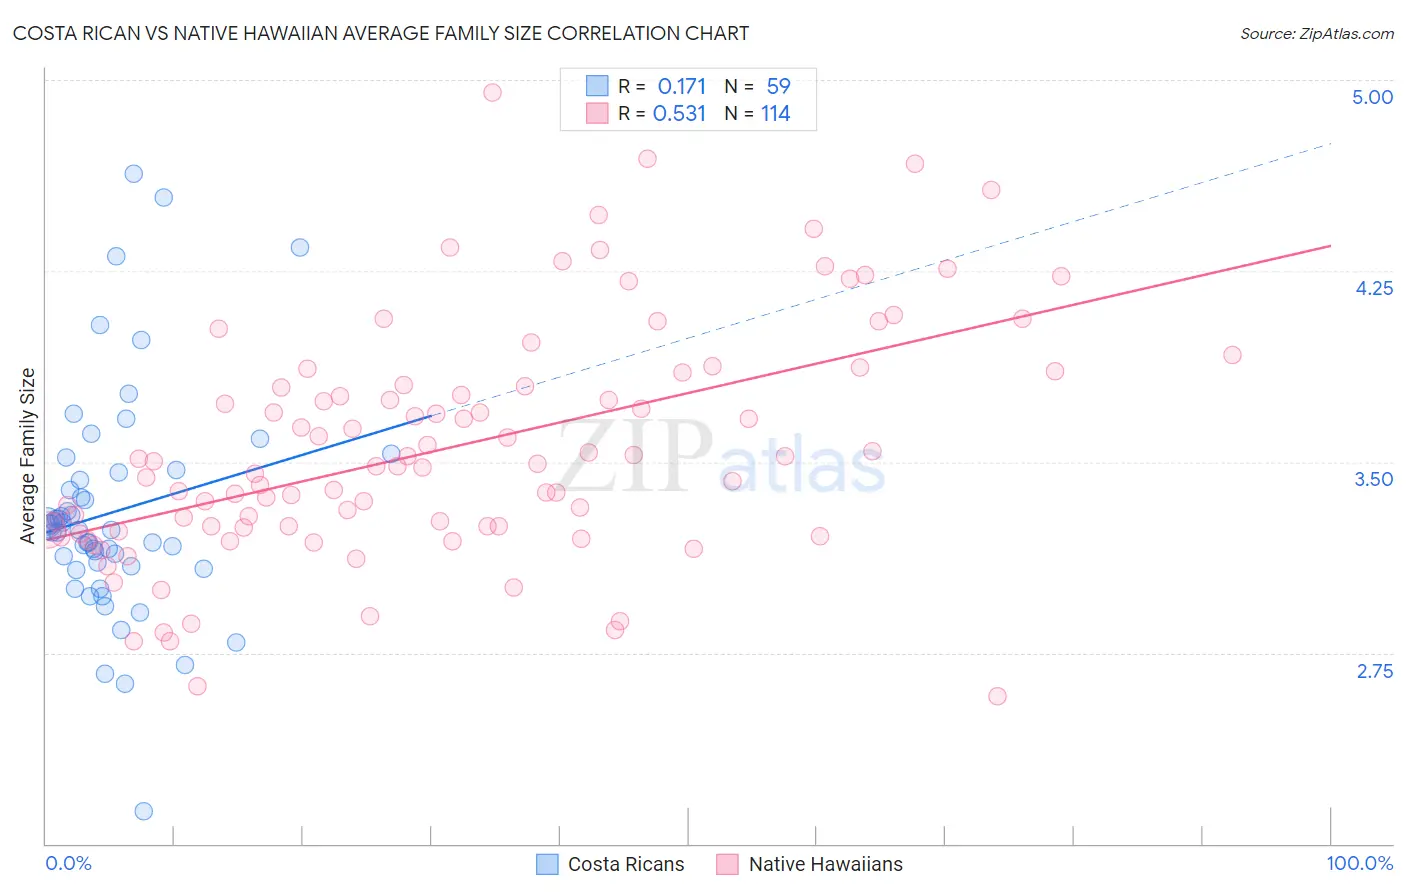
Costa Rican vs Native Hawaiian Average Family Size Correlation Chart
The statistical analysis conducted on geographies consisting of 253,470,463 people shows a poor positive correlation between the proportion of Costa Ricans and average family size in the United States with a correlation coefficient (R) of 0.171 and weighted average of 3.26. Similarly, the statistical analysis conducted on geographies consisting of 331,878,111 people shows a substantial positive correlation between the proportion of Native Hawaiians and average family size in the United States with a correlation coefficient (R) of 0.531 and weighted average of 3.43, a difference of 5.3%.
Average Family Size Correlation Summary
| Measurement | Costa Rican | Native Hawaiian |
| Minimum | 2.13 | 2.58 |
| Maximum | 4.63 | 4.95 |
| Range | 2.50 | 2.37 |
| Mean | 3.30 | 3.56 |
| Median | 3.23 | 3.49 |
| Interquartile 25% (IQ1) | 3.09 | 3.24 |
| Interquartile 75% (IQ3) | 3.46 | 3.80 |
| Interquartile Range (IQR) | 0.37 | 0.56 |
| Standard Deviation (Sample) | 0.44 | 0.47 |
| Standard Deviation (Population) | 0.44 | 0.46 |
Similar Demographics by Average Family Size
Demographics Similar to Costa Ricans by Average Family Size
In terms of average family size, the demographic groups most similar to Costa Ricans are Immigrants from Venezuela (3.26, a difference of 0.020%), Immigrants from Western Asia (3.26, a difference of 0.040%), Laotian (3.26, a difference of 0.070%), African (3.25, a difference of 0.070%), and Immigrants from Hong Kong (3.26, a difference of 0.080%).
| Demographics | Rating | Rank | Average Family Size |
| Immigrants | Cuba | 91.3 /100 | #125 | Exceptional 3.26 |
| Immigrants | Costa Rica | 90.7 /100 | #126 | Exceptional 3.26 |
| Immigrants | Syria | 90.6 /100 | #127 | Exceptional 3.26 |
| Colombians | 89.9 /100 | #128 | Excellent 3.26 |
| Immigrants | Hong Kong | 88.6 /100 | #129 | Excellent 3.26 |
| Laotians | 88.5 /100 | #130 | Excellent 3.26 |
| Immigrants | Western Asia | 87.7 /100 | #131 | Excellent 3.26 |
| Costa Ricans | 86.8 /100 | #132 | Excellent 3.26 |
| Immigrants | Venezuela | 86.3 /100 | #133 | Excellent 3.26 |
| Africans | 84.9 /100 | #134 | Excellent 3.25 |
| Panamanians | 84.2 /100 | #135 | Excellent 3.25 |
| Comanche | 82.8 /100 | #136 | Excellent 3.25 |
| Immigrants | Middle Africa | 82.4 /100 | #137 | Excellent 3.25 |
| Cubans | 81.8 /100 | #138 | Excellent 3.25 |
| Immigrants | Ethiopia | 81.6 /100 | #139 | Excellent 3.25 |
Demographics Similar to Native Hawaiians by Average Family Size
In terms of average family size, the demographic groups most similar to Native Hawaiians are Mexican American Indian (3.43, a difference of 0.010%), Immigrants from Latin America (3.42, a difference of 0.13%), Nepalese (3.42, a difference of 0.22%), Samoan (3.42, a difference of 0.25%), and Central American (3.41, a difference of 0.45%).
| Demographics | Rating | Rank | Average Family Size |
| Mexicans | 100.0 /100 | #19 | Exceptional 3.48 |
| Cheyenne | 100.0 /100 | #20 | Exceptional 3.47 |
| Yuman | 100.0 /100 | #21 | Exceptional 3.47 |
| Apache | 100.0 /100 | #22 | Exceptional 3.46 |
| Immigrants | Fiji | 100.0 /100 | #23 | Exceptional 3.45 |
| Natives/Alaskans | 100.0 /100 | #24 | Exceptional 3.45 |
| Yakama | 100.0 /100 | #25 | Exceptional 3.45 |
| Native Hawaiians | 100.0 /100 | #26 | Exceptional 3.43 |
| Mexican American Indians | 100.0 /100 | #27 | Exceptional 3.43 |
| Immigrants | Latin America | 100.0 /100 | #28 | Exceptional 3.42 |
| Nepalese | 100.0 /100 | #29 | Exceptional 3.42 |
| Samoans | 100.0 /100 | #30 | Exceptional 3.42 |
| Central Americans | 100.0 /100 | #31 | Exceptional 3.41 |
| Immigrants | Guatemala | 100.0 /100 | #32 | Exceptional 3.41 |
| Hawaiians | 100.0 /100 | #33 | Exceptional 3.41 |