White/Caucasian vs French American Indian Family Households with Children
COMPARE
White/Caucasian
French American Indian
Family Households with Children
Family Households with Children Comparison
Whites/Caucasians
French American Indians
27.4%
FAMILY HOUSEHOLDS WITH CHILDREN
50.0/ 100
METRIC RATING
174th/ 347
METRIC RANK
26.6%
FAMILY HOUSEHOLDS WITH CHILDREN
0.3/ 100
METRIC RATING
282nd/ 347
METRIC RANK
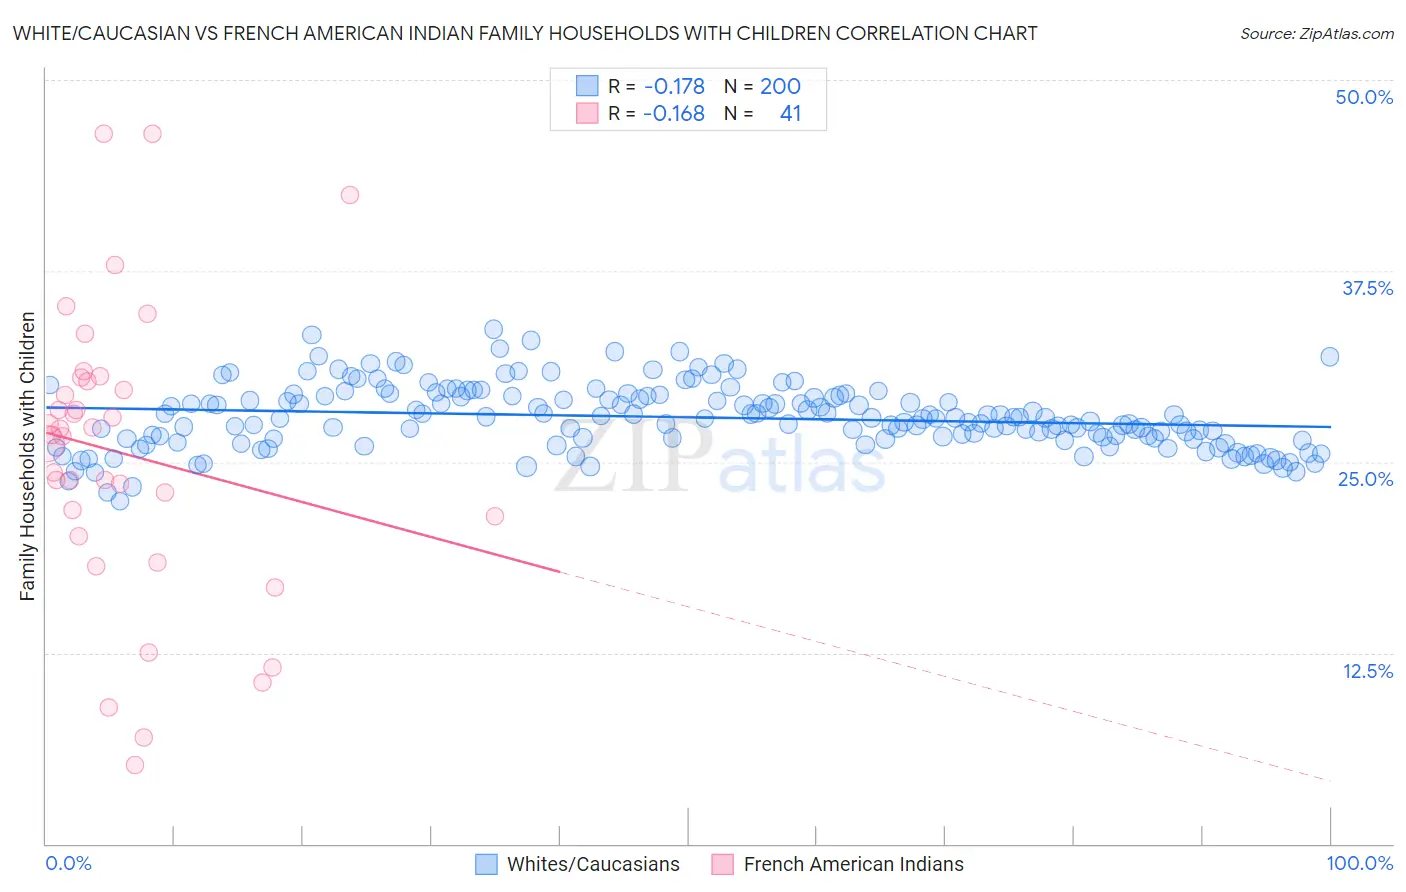
White/Caucasian vs French American Indian Family Households with Children Correlation Chart
The statistical analysis conducted on geographies consisting of 583,762,337 people shows a poor negative correlation between the proportion of Whites/Caucasians and percentage of family households with children in the United States with a correlation coefficient (R) of -0.178 and weighted average of 27.4%. Similarly, the statistical analysis conducted on geographies consisting of 131,954,701 people shows a poor negative correlation between the proportion of French American Indians and percentage of family households with children in the United States with a correlation coefficient (R) of -0.168 and weighted average of 26.6%, a difference of 3.3%.
Family Households with Children Correlation Summary
| Measurement | White/Caucasian | French American Indian |
| Minimum | 22.4% | 5.1% |
| Maximum | 33.7% | 46.5% |
| Range | 11.3% | 41.4% |
| Mean | 27.9% | 25.5% |
| Median | 27.8% | 26.7% |
| Interquartile 25% (IQ1) | 26.5% | 20.8% |
| Interquartile 75% (IQ3) | 29.3% | 30.4% |
| Interquartile Range (IQR) | 2.8% | 9.6% |
| Standard Deviation (Sample) | 2.1% | 9.5% |
| Standard Deviation (Population) | 2.1% | 9.4% |
Similar Demographics by Family Households with Children
Demographics Similar to Whites/Caucasians by Family Households with Children
In terms of family households with children, the demographic groups most similar to Whites/Caucasians are British (27.4%, a difference of 0.0%), Immigrants from China (27.4%, a difference of 0.010%), Ugandan (27.4%, a difference of 0.020%), Spanish American (27.4%, a difference of 0.020%), and Immigrants from Argentina (27.5%, a difference of 0.050%).
| Demographics | Rating | Rank | Family Households with Children |
| Dominicans | 61.1 /100 | #167 | Good 27.5% |
| Immigrants | Kuwait | 60.9 /100 | #168 | Good 27.5% |
| Seminole | 56.9 /100 | #169 | Average 27.5% |
| Cherokee | 56.7 /100 | #170 | Average 27.5% |
| Blackfeet | 54.3 /100 | #171 | Average 27.5% |
| Israelis | 53.9 /100 | #172 | Average 27.5% |
| Immigrants | Argentina | 52.2 /100 | #173 | Average 27.5% |
| Whites/Caucasians | 50.0 /100 | #174 | Average 27.4% |
| British | 49.9 /100 | #175 | Average 27.4% |
| Immigrants | China | 49.6 /100 | #176 | Average 27.4% |
| Ugandans | 49.2 /100 | #177 | Average 27.4% |
| Spanish Americans | 48.9 /100 | #178 | Average 27.4% |
| Turks | 46.9 /100 | #179 | Average 27.4% |
| Immigrants | Turkey | 46.9 /100 | #180 | Average 27.4% |
| Aleuts | 46.7 /100 | #181 | Average 27.4% |
Demographics Similar to French American Indians by Family Households with Children
In terms of family households with children, the demographic groups most similar to French American Indians are Lithuanian (26.6%, a difference of 0.010%), Immigrants from North America (26.6%, a difference of 0.070%), Immigrants from Canada (26.5%, a difference of 0.090%), Senegalese (26.6%, a difference of 0.11%), and Cambodian (26.5%, a difference of 0.12%).
| Demographics | Rating | Rank | Family Households with Children |
| Immigrants | Northern Europe | 0.5 /100 | #275 | Tragic 26.7% |
| Immigrants | Spain | 0.5 /100 | #276 | Tragic 26.6% |
| Celtics | 0.4 /100 | #277 | Tragic 26.6% |
| Immigrants | Europe | 0.4 /100 | #278 | Tragic 26.6% |
| Finns | 0.4 /100 | #279 | Tragic 26.6% |
| Senegalese | 0.4 /100 | #280 | Tragic 26.6% |
| Lithuanians | 0.3 /100 | #281 | Tragic 26.6% |
| French American Indians | 0.3 /100 | #282 | Tragic 26.6% |
| Immigrants | North America | 0.3 /100 | #283 | Tragic 26.6% |
| Immigrants | Canada | 0.3 /100 | #284 | Tragic 26.5% |
| Cambodians | 0.2 /100 | #285 | Tragic 26.5% |
| Immigrants | Senegal | 0.2 /100 | #286 | Tragic 26.5% |
| Shoshone | 0.2 /100 | #287 | Tragic 26.5% |
| Russians | 0.2 /100 | #288 | Tragic 26.5% |
| Immigrants | Sweden | 0.2 /100 | #289 | Tragic 26.5% |