White/Caucasian vs Immigrants from Nigeria Family Households with Children
COMPARE
White/Caucasian
Immigrants from Nigeria
Family Households with Children
Family Households with Children Comparison
Whites/Caucasians
Immigrants from Nigeria
27.4%
FAMILY HOUSEHOLDS WITH CHILDREN
50.0/ 100
METRIC RATING
174th/ 347
METRIC RANK
28.6%
FAMILY HOUSEHOLDS WITH CHILDREN
100.0/ 100
METRIC RATING
59th/ 347
METRIC RANK
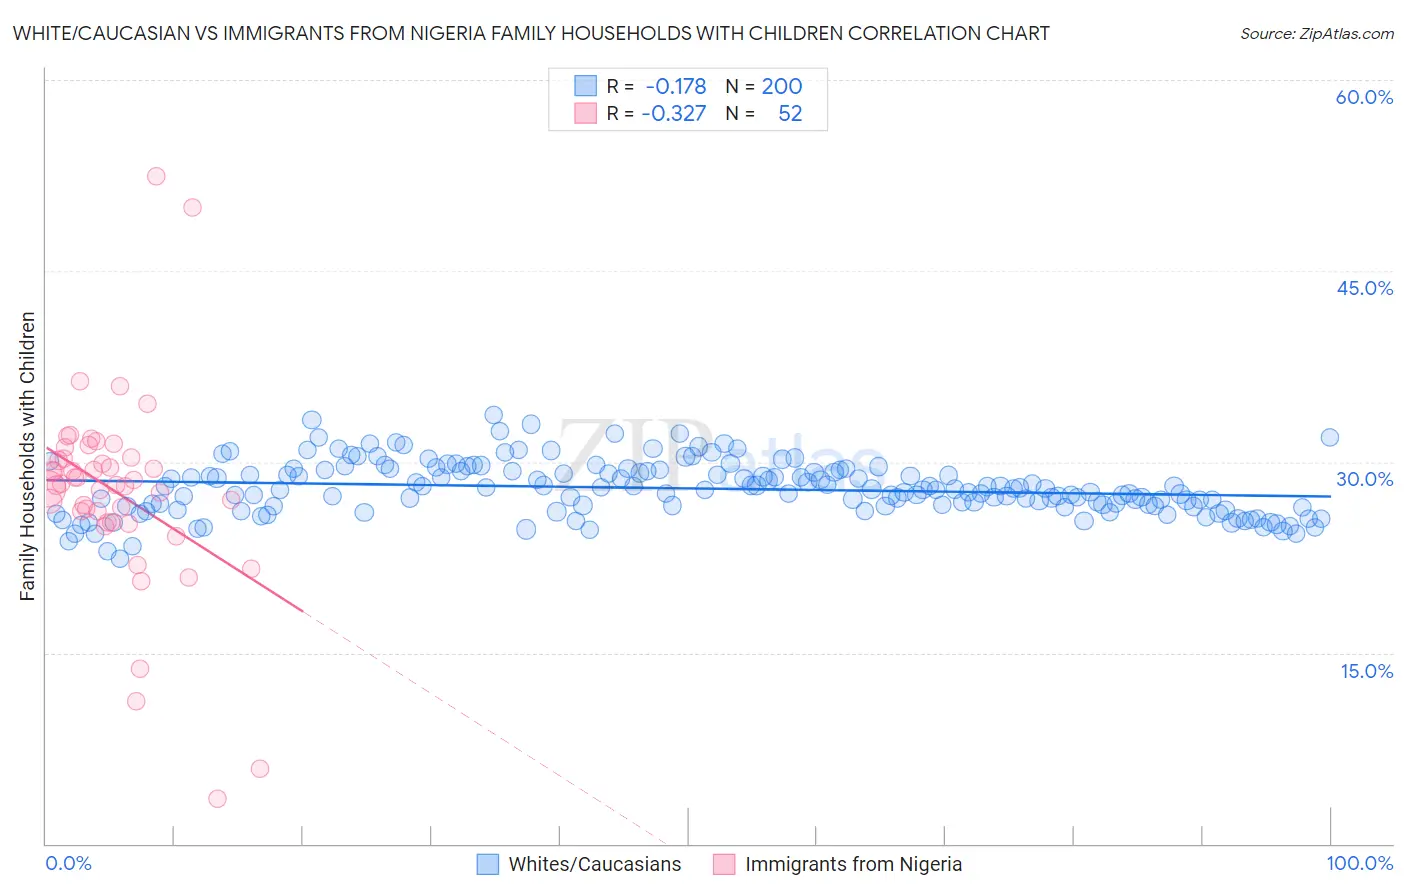
White/Caucasian vs Immigrants from Nigeria Family Households with Children Correlation Chart
The statistical analysis conducted on geographies consisting of 583,762,337 people shows a poor negative correlation between the proportion of Whites/Caucasians and percentage of family households with children in the United States with a correlation coefficient (R) of -0.178 and weighted average of 27.4%. Similarly, the statistical analysis conducted on geographies consisting of 283,169,059 people shows a mild negative correlation between the proportion of Immigrants from Nigeria and percentage of family households with children in the United States with a correlation coefficient (R) of -0.327 and weighted average of 28.6%, a difference of 4.2%.
Family Households with Children Correlation Summary
| Measurement | White/Caucasian | Immigrants from Nigeria |
| Minimum | 22.4% | 3.6% |
| Maximum | 33.7% | 52.5% |
| Range | 11.3% | 48.9% |
| Mean | 27.9% | 27.7% |
| Median | 27.8% | 28.2% |
| Interquartile 25% (IQ1) | 26.5% | 25.7% |
| Interquartile 75% (IQ3) | 29.3% | 30.3% |
| Interquartile Range (IQR) | 2.8% | 4.6% |
| Standard Deviation (Sample) | 2.1% | 7.9% |
| Standard Deviation (Population) | 2.1% | 7.8% |
Similar Demographics by Family Households with Children
Demographics Similar to Whites/Caucasians by Family Households with Children
In terms of family households with children, the demographic groups most similar to Whites/Caucasians are British (27.4%, a difference of 0.0%), Immigrants from China (27.4%, a difference of 0.010%), Ugandan (27.4%, a difference of 0.020%), Spanish American (27.4%, a difference of 0.020%), and Immigrants from Argentina (27.5%, a difference of 0.050%).
| Demographics | Rating | Rank | Family Households with Children |
| Dominicans | 61.1 /100 | #167 | Good 27.5% |
| Immigrants | Kuwait | 60.9 /100 | #168 | Good 27.5% |
| Seminole | 56.9 /100 | #169 | Average 27.5% |
| Cherokee | 56.7 /100 | #170 | Average 27.5% |
| Blackfeet | 54.3 /100 | #171 | Average 27.5% |
| Israelis | 53.9 /100 | #172 | Average 27.5% |
| Immigrants | Argentina | 52.2 /100 | #173 | Average 27.5% |
| Whites/Caucasians | 50.0 /100 | #174 | Average 27.4% |
| British | 49.9 /100 | #175 | Average 27.4% |
| Immigrants | China | 49.6 /100 | #176 | Average 27.4% |
| Ugandans | 49.2 /100 | #177 | Average 27.4% |
| Spanish Americans | 48.9 /100 | #178 | Average 27.4% |
| Turks | 46.9 /100 | #179 | Average 27.4% |
| Immigrants | Turkey | 46.9 /100 | #180 | Average 27.4% |
| Aleuts | 46.7 /100 | #181 | Average 27.4% |
Demographics Similar to Immigrants from Nigeria by Family Households with Children
In terms of family households with children, the demographic groups most similar to Immigrants from Nigeria are Hmong (28.6%, a difference of 0.060%), Immigrants from Ghana (28.6%, a difference of 0.13%), Egyptian (28.6%, a difference of 0.13%), Immigrants from Lebanon (28.6%, a difference of 0.14%), and Filipino (28.6%, a difference of 0.21%).
| Demographics | Rating | Rank | Family Households with Children |
| Guatemalans | 100.0 /100 | #52 | Exceptional 28.9% |
| Immigrants | Cambodia | 100.0 /100 | #53 | Exceptional 28.9% |
| Sierra Leoneans | 100.0 /100 | #54 | Exceptional 28.9% |
| Immigrants | Asia | 100.0 /100 | #55 | Exceptional 28.8% |
| Immigrants | Guatemala | 100.0 /100 | #56 | Exceptional 28.8% |
| Danes | 100.0 /100 | #57 | Exceptional 28.7% |
| Hawaiians | 100.0 /100 | #58 | Exceptional 28.7% |
| Immigrants | Nigeria | 100.0 /100 | #59 | Exceptional 28.6% |
| Hmong | 99.9 /100 | #60 | Exceptional 28.6% |
| Immigrants | Ghana | 99.9 /100 | #61 | Exceptional 28.6% |
| Egyptians | 99.9 /100 | #62 | Exceptional 28.6% |
| Immigrants | Lebanon | 99.9 /100 | #63 | Exceptional 28.6% |
| Filipinos | 99.9 /100 | #64 | Exceptional 28.6% |
| Hondurans | 99.9 /100 | #65 | Exceptional 28.5% |
| Immigrants | Egypt | 99.9 /100 | #66 | Exceptional 28.5% |