Lumbee vs Immigrants from Indonesia Family Households with Children
COMPARE
Lumbee
Immigrants from Indonesia
Family Households with Children
Family Households with Children Comparison
Lumbee
Immigrants from Indonesia
26.3%
FAMILY HOUSEHOLDS WITH CHILDREN
0.0/ 100
METRIC RATING
308th/ 347
METRIC RANK
28.5%
FAMILY HOUSEHOLDS WITH CHILDREN
99.9/ 100
METRIC RATING
72nd/ 347
METRIC RANK
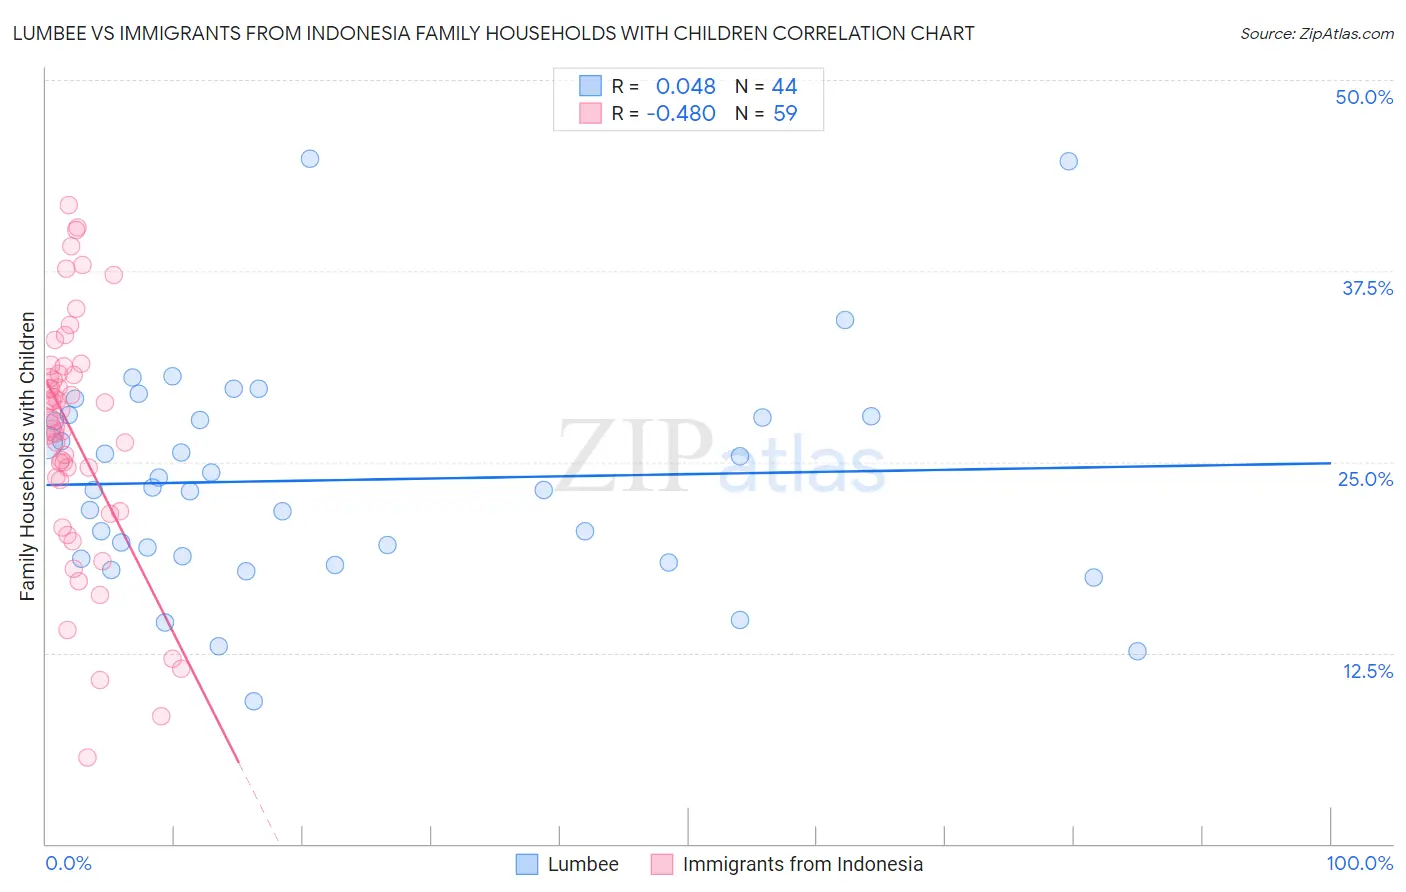
Lumbee vs Immigrants from Indonesia Family Households with Children Correlation Chart
The statistical analysis conducted on geographies consisting of 92,262,389 people shows no correlation between the proportion of Lumbee and percentage of family households with children in the United States with a correlation coefficient (R) of 0.048 and weighted average of 26.3%. Similarly, the statistical analysis conducted on geographies consisting of 215,654,509 people shows a moderate negative correlation between the proportion of Immigrants from Indonesia and percentage of family households with children in the United States with a correlation coefficient (R) of -0.480 and weighted average of 28.5%, a difference of 8.4%.
Family Households with Children Correlation Summary
| Measurement | Lumbee | Immigrants from Indonesia |
| Minimum | 9.3% | 5.7% |
| Maximum | 44.9% | 41.8% |
| Range | 35.5% | 36.1% |
| Mean | 23.8% | 26.6% |
| Median | 23.2% | 27.4% |
| Interquartile 25% (IQ1) | 18.7% | 21.7% |
| Interquartile 75% (IQ3) | 27.9% | 30.8% |
| Interquartile Range (IQR) | 9.2% | 9.0% |
| Standard Deviation (Sample) | 7.2% | 8.0% |
| Standard Deviation (Population) | 7.1% | 7.9% |
Similar Demographics by Family Households with Children
Demographics Similar to Lumbee by Family Households with Children
In terms of family households with children, the demographic groups most similar to Lumbee are West Indian (26.3%, a difference of 0.020%), Bermudan (26.3%, a difference of 0.10%), Immigrants from Somalia (26.3%, a difference of 0.11%), Guyanese (26.3%, a difference of 0.12%), and Immigrants from Bahamas (26.3%, a difference of 0.14%).
| Demographics | Rating | Rank | Family Households with Children |
| Immigrants | Trinidad and Tobago | 0.1 /100 | #301 | Tragic 26.4% |
| Serbians | 0.1 /100 | #302 | Tragic 26.4% |
| Immigrants | Guyana | 0.1 /100 | #303 | Tragic 26.3% |
| Immigrants | Bahamas | 0.1 /100 | #304 | Tragic 26.3% |
| Guyanese | 0.1 /100 | #305 | Tragic 26.3% |
| Bermudans | 0.1 /100 | #306 | Tragic 26.3% |
| West Indians | 0.0 /100 | #307 | Tragic 26.3% |
| Lumbee | 0.0 /100 | #308 | Tragic 26.3% |
| Immigrants | Somalia | 0.0 /100 | #309 | Tragic 26.3% |
| Marshallese | 0.0 /100 | #310 | Tragic 26.2% |
| Colville | 0.0 /100 | #311 | Tragic 26.2% |
| Immigrants | Czechoslovakia | 0.0 /100 | #312 | Tragic 26.2% |
| Cree | 0.0 /100 | #313 | Tragic 26.2% |
| French Canadians | 0.0 /100 | #314 | Tragic 26.1% |
| Immigrants | Norway | 0.0 /100 | #315 | Tragic 26.1% |
Demographics Similar to Immigrants from Indonesia by Family Households with Children
In terms of family households with children, the demographic groups most similar to Immigrants from Indonesia are Burmese (28.5%, a difference of 0.010%), Immigrants from Honduras (28.5%, a difference of 0.020%), Iraqi (28.5%, a difference of 0.030%), Laotian (28.5%, a difference of 0.040%), and Immigrants from Korea (28.5%, a difference of 0.080%).
| Demographics | Rating | Rank | Family Households with Children |
| Hondurans | 99.9 /100 | #65 | Exceptional 28.5% |
| Immigrants | Egypt | 99.9 /100 | #66 | Exceptional 28.5% |
| Ghanaians | 99.9 /100 | #67 | Exceptional 28.5% |
| Houma | 99.9 /100 | #68 | Exceptional 28.5% |
| Immigrants | Korea | 99.9 /100 | #69 | Exceptional 28.5% |
| Immigrants | Honduras | 99.9 /100 | #70 | Exceptional 28.5% |
| Burmese | 99.9 /100 | #71 | Exceptional 28.5% |
| Immigrants | Indonesia | 99.9 /100 | #72 | Exceptional 28.5% |
| Iraqis | 99.9 /100 | #73 | Exceptional 28.5% |
| Laotians | 99.9 /100 | #74 | Exceptional 28.5% |
| Immigrants | Jordan | 99.9 /100 | #75 | Exceptional 28.4% |
| Immigrants | Sri Lanka | 99.9 /100 | #76 | Exceptional 28.4% |
| Nigerians | 99.8 /100 | #77 | Exceptional 28.4% |
| Immigrants | Nepal | 99.8 /100 | #78 | Exceptional 28.4% |
| Immigrants | Iraq | 99.8 /100 | #79 | Exceptional 28.4% |