Immigrants from Central America vs Immigrants from Guyana Single Mother Households
COMPARE
Immigrants from Central America
Immigrants from Guyana
Single Mother Households
Single Mother Households Comparison
Immigrants from Central America
Immigrants from Guyana
8.1%
SINGLE MOTHER HOUSEHOLDS
0.0/ 100
METRIC RATING
308th/ 347
METRIC RANK
7.6%
SINGLE MOTHER HOUSEHOLDS
0.1/ 100
METRIC RATING
274th/ 347
METRIC RANK
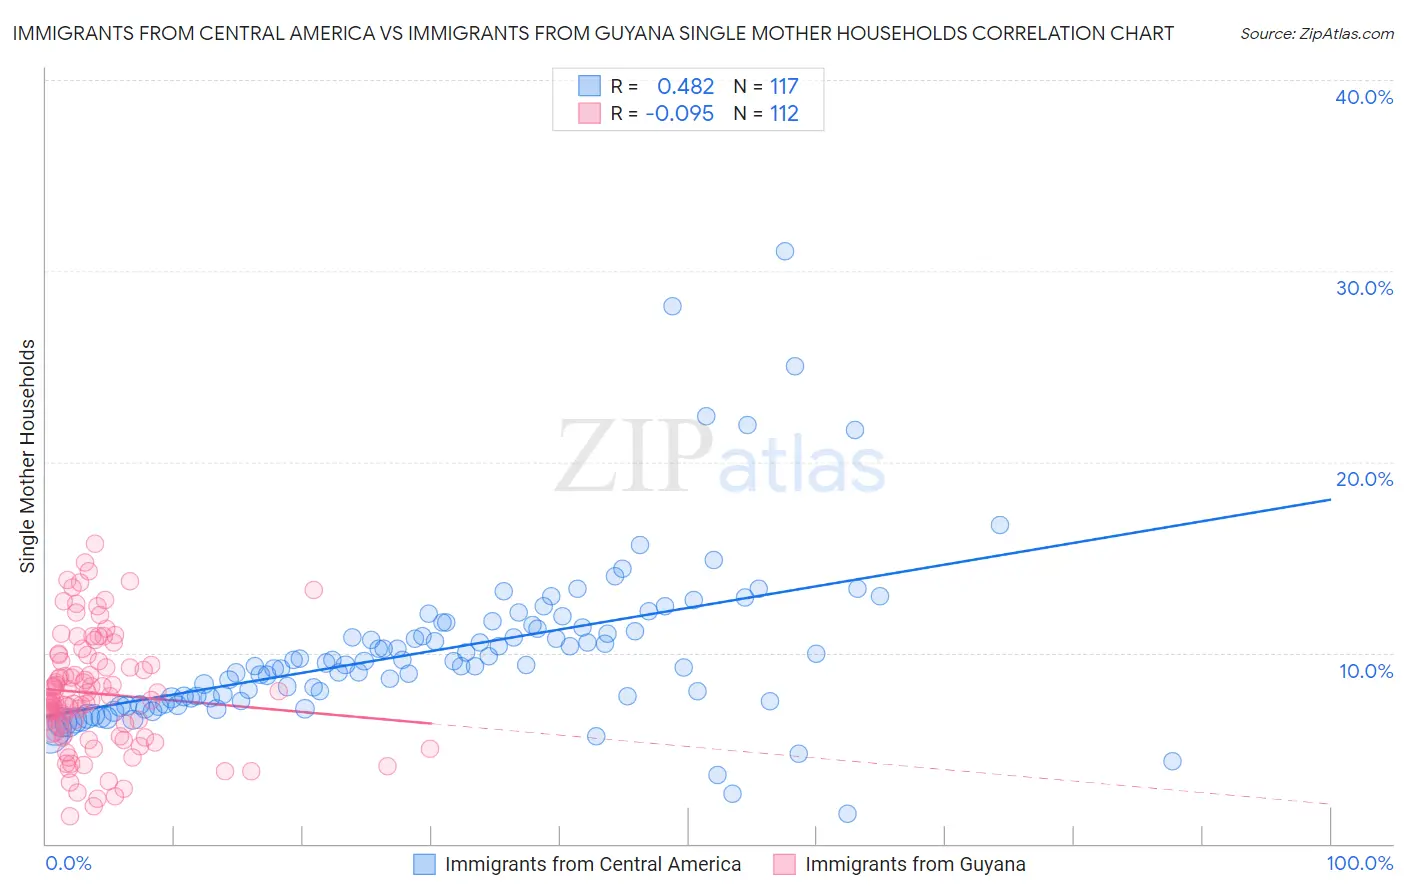
Immigrants from Central America vs Immigrants from Guyana Single Mother Households Correlation Chart
The statistical analysis conducted on geographies consisting of 533,472,888 people shows a moderate positive correlation between the proportion of Immigrants from Central America and percentage of single mother households in the United States with a correlation coefficient (R) of 0.482 and weighted average of 8.1%. Similarly, the statistical analysis conducted on geographies consisting of 183,513,161 people shows a slight negative correlation between the proportion of Immigrants from Guyana and percentage of single mother households in the United States with a correlation coefficient (R) of -0.095 and weighted average of 7.6%, a difference of 6.5%.
Single Mother Households Correlation Summary
| Measurement | Immigrants from Central America | Immigrants from Guyana |
| Minimum | 1.6% | 1.5% |
| Maximum | 31.0% | 15.7% |
| Range | 29.5% | 14.2% |
| Mean | 10.1% | 7.9% |
| Median | 9.4% | 7.5% |
| Interquartile 25% (IQ1) | 7.5% | 5.7% |
| Interquartile 75% (IQ3) | 11.4% | 9.6% |
| Interquartile Range (IQR) | 3.9% | 3.8% |
| Standard Deviation (Sample) | 4.4% | 3.0% |
| Standard Deviation (Population) | 4.4% | 3.0% |
Similar Demographics by Single Mother Households
Demographics Similar to Immigrants from Central America by Single Mother Households
In terms of single mother households, the demographic groups most similar to Immigrants from Central America are Immigrants from St. Vincent and the Grenadines (8.0%, a difference of 0.020%), Immigrants from Barbados (8.0%, a difference of 0.26%), Colville (8.0%, a difference of 0.33%), Native/Alaskan (8.0%, a difference of 0.38%), and Cheyenne (8.1%, a difference of 0.44%).
| Demographics | Rating | Rank | Single Mother Households |
| Chippewa | 0.0 /100 | #301 | Tragic 8.0% |
| Immigrants | Ghana | 0.0 /100 | #302 | Tragic 8.0% |
| Immigrants | Bahamas | 0.0 /100 | #303 | Tragic 8.0% |
| Natives/Alaskans | 0.0 /100 | #304 | Tragic 8.0% |
| Colville | 0.0 /100 | #305 | Tragic 8.0% |
| Immigrants | Barbados | 0.0 /100 | #306 | Tragic 8.0% |
| Immigrants | St. Vincent and the Grenadines | 0.0 /100 | #307 | Tragic 8.0% |
| Immigrants | Central America | 0.0 /100 | #308 | Tragic 8.1% |
| Cheyenne | 0.0 /100 | #309 | Tragic 8.1% |
| Hondurans | 0.0 /100 | #310 | Tragic 8.1% |
| Immigrants | Congo | 0.0 /100 | #311 | Tragic 8.1% |
| Bangladeshis | 0.0 /100 | #312 | Tragic 8.1% |
| Immigrants | Grenada | 0.0 /100 | #313 | Tragic 8.2% |
| Immigrants | Mexico | 0.0 /100 | #314 | Tragic 8.2% |
| Immigrants | Western Africa | 0.0 /100 | #315 | Tragic 8.2% |
Demographics Similar to Immigrants from Guyana by Single Mother Households
In terms of single mother households, the demographic groups most similar to Immigrants from Guyana are Belizean (7.6%, a difference of 0.040%), Central American Indian (7.6%, a difference of 0.10%), Salvadoran (7.5%, a difference of 0.36%), Immigrants from the Azores (7.5%, a difference of 0.36%), and Immigrants from Cuba (7.5%, a difference of 0.45%).
| Demographics | Rating | Rank | Single Mother Households |
| Blackfeet | 0.1 /100 | #267 | Tragic 7.5% |
| Indonesians | 0.1 /100 | #268 | Tragic 7.5% |
| Somalis | 0.1 /100 | #269 | Tragic 7.5% |
| Immigrants | Cuba | 0.1 /100 | #270 | Tragic 7.5% |
| Salvadorans | 0.1 /100 | #271 | Tragic 7.5% |
| Immigrants | Azores | 0.1 /100 | #272 | Tragic 7.5% |
| Belizeans | 0.1 /100 | #273 | Tragic 7.6% |
| Immigrants | Guyana | 0.1 /100 | #274 | Tragic 7.6% |
| Central American Indians | 0.1 /100 | #275 | Tragic 7.6% |
| Guyanese | 0.1 /100 | #276 | Tragic 7.6% |
| Immigrants | Trinidad and Tobago | 0.1 /100 | #277 | Tragic 7.6% |
| Central Americans | 0.1 /100 | #278 | Tragic 7.6% |
| Immigrants | El Salvador | 0.0 /100 | #279 | Tragic 7.6% |
| Immigrants | Sierra Leone | 0.0 /100 | #280 | Tragic 7.7% |
| Immigrants | Laos | 0.0 /100 | #281 | Tragic 7.7% |