Hawaiian vs Immigrants from Guyana Single Mother Households
COMPARE
Hawaiian
Immigrants from Guyana
Single Mother Households
Single Mother Households Comparison
Hawaiians
Immigrants from Guyana
6.6%
SINGLE MOTHER HOUSEHOLDS
16.1/ 100
METRIC RATING
198th/ 347
METRIC RANK
7.6%
SINGLE MOTHER HOUSEHOLDS
0.1/ 100
METRIC RATING
274th/ 347
METRIC RANK
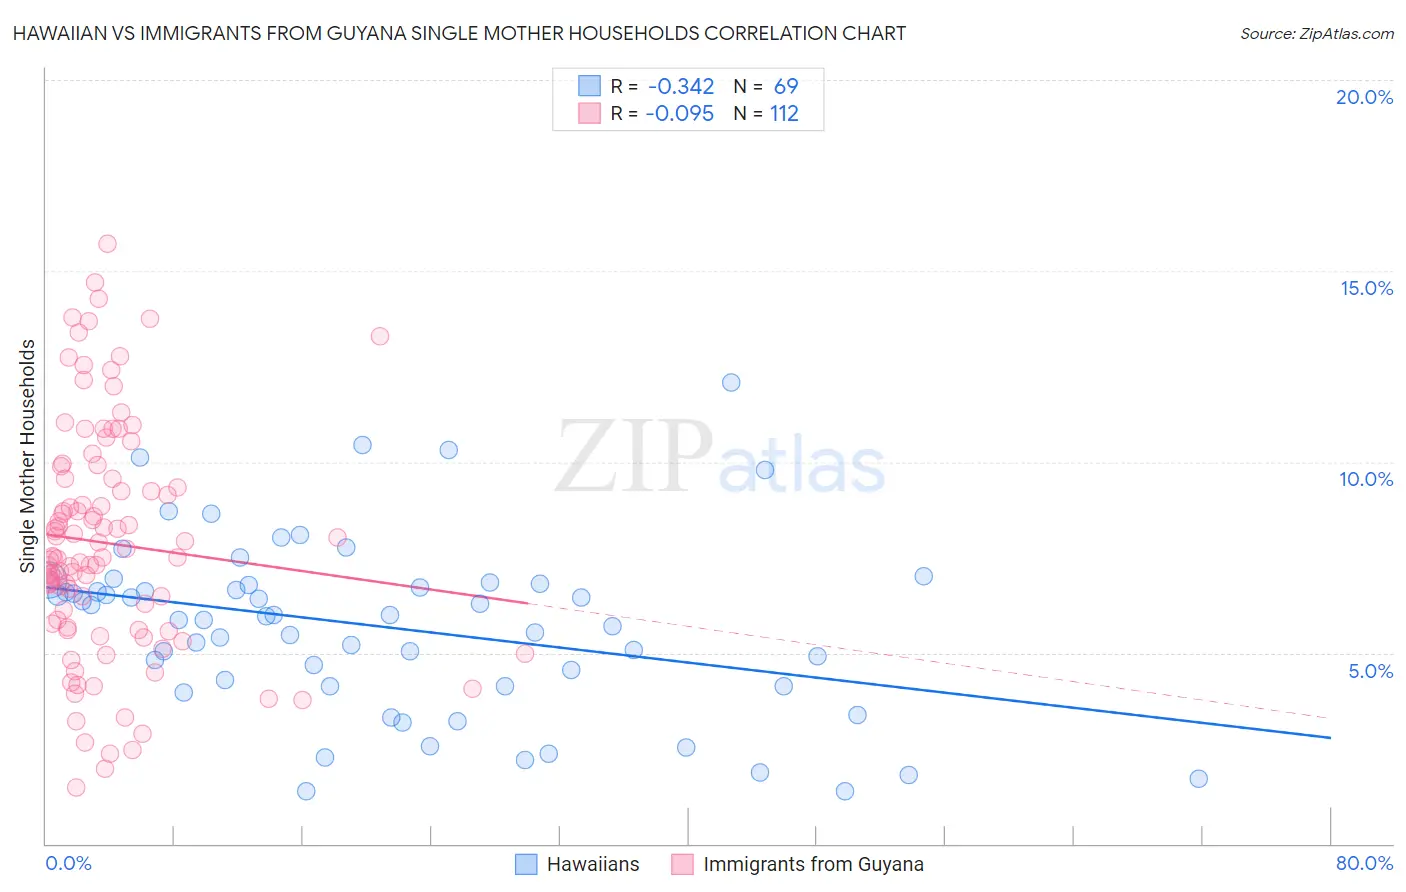
Hawaiian vs Immigrants from Guyana Single Mother Households Correlation Chart
The statistical analysis conducted on geographies consisting of 326,738,155 people shows a mild negative correlation between the proportion of Hawaiians and percentage of single mother households in the United States with a correlation coefficient (R) of -0.342 and weighted average of 6.6%. Similarly, the statistical analysis conducted on geographies consisting of 183,513,161 people shows a slight negative correlation between the proportion of Immigrants from Guyana and percentage of single mother households in the United States with a correlation coefficient (R) of -0.095 and weighted average of 7.6%, a difference of 14.6%.
Single Mother Households Correlation Summary
| Measurement | Hawaiian | Immigrants from Guyana |
| Minimum | 1.4% | 1.5% |
| Maximum | 12.1% | 15.7% |
| Range | 10.7% | 14.2% |
| Mean | 5.7% | 7.9% |
| Median | 5.9% | 7.5% |
| Interquartile 25% (IQ1) | 4.1% | 5.7% |
| Interquartile 75% (IQ3) | 6.8% | 9.6% |
| Interquartile Range (IQR) | 2.7% | 3.8% |
| Standard Deviation (Sample) | 2.3% | 3.0% |
| Standard Deviation (Population) | 2.3% | 3.0% |
Similar Demographics by Single Mother Households
Demographics Similar to Hawaiians by Single Mother Households
In terms of single mother households, the demographic groups most similar to Hawaiians are Potawatomi (6.6%, a difference of 0.11%), Moroccan (6.6%, a difference of 0.25%), Immigrants from Ethiopia (6.6%, a difference of 0.27%), South American (6.6%, a difference of 0.36%), and Uruguayan (6.6%, a difference of 0.36%).
| Demographics | Rating | Rank | Single Mother Households |
| Samoans | 21.2 /100 | #191 | Fair 6.5% |
| Americans | 19.0 /100 | #192 | Poor 6.6% |
| Colombians | 18.3 /100 | #193 | Poor 6.6% |
| Immigrants | Uganda | 18.3 /100 | #194 | Poor 6.6% |
| South Americans | 18.0 /100 | #195 | Poor 6.6% |
| Uruguayans | 18.0 /100 | #196 | Poor 6.6% |
| Moroccans | 17.4 /100 | #197 | Poor 6.6% |
| Hawaiians | 16.1 /100 | #198 | Poor 6.6% |
| Potawatomi | 15.5 /100 | #199 | Poor 6.6% |
| Immigrants | Ethiopia | 14.7 /100 | #200 | Poor 6.6% |
| Venezuelans | 12.9 /100 | #201 | Poor 6.6% |
| Guamanians/Chamorros | 12.4 /100 | #202 | Poor 6.6% |
| Immigrants | Peru | 12.0 /100 | #203 | Poor 6.7% |
| Immigrants | Fiji | 11.9 /100 | #204 | Poor 6.7% |
| Cree | 11.9 /100 | #205 | Poor 6.7% |
Demographics Similar to Immigrants from Guyana by Single Mother Households
In terms of single mother households, the demographic groups most similar to Immigrants from Guyana are Belizean (7.6%, a difference of 0.040%), Central American Indian (7.6%, a difference of 0.10%), Salvadoran (7.5%, a difference of 0.36%), Immigrants from the Azores (7.5%, a difference of 0.36%), and Immigrants from Cuba (7.5%, a difference of 0.45%).
| Demographics | Rating | Rank | Single Mother Households |
| Blackfeet | 0.1 /100 | #267 | Tragic 7.5% |
| Indonesians | 0.1 /100 | #268 | Tragic 7.5% |
| Somalis | 0.1 /100 | #269 | Tragic 7.5% |
| Immigrants | Cuba | 0.1 /100 | #270 | Tragic 7.5% |
| Salvadorans | 0.1 /100 | #271 | Tragic 7.5% |
| Immigrants | Azores | 0.1 /100 | #272 | Tragic 7.5% |
| Belizeans | 0.1 /100 | #273 | Tragic 7.6% |
| Immigrants | Guyana | 0.1 /100 | #274 | Tragic 7.6% |
| Central American Indians | 0.1 /100 | #275 | Tragic 7.6% |
| Guyanese | 0.1 /100 | #276 | Tragic 7.6% |
| Immigrants | Trinidad and Tobago | 0.1 /100 | #277 | Tragic 7.6% |
| Central Americans | 0.1 /100 | #278 | Tragic 7.6% |
| Immigrants | El Salvador | 0.0 /100 | #279 | Tragic 7.6% |
| Immigrants | Sierra Leone | 0.0 /100 | #280 | Tragic 7.7% |
| Immigrants | Laos | 0.0 /100 | #281 | Tragic 7.7% |