Paiute vs Immigrants from Guyana Single Mother Households
COMPARE
Paiute
Immigrants from Guyana
Single Mother Households
Single Mother Households Comparison
Paiute
Immigrants from Guyana
7.0%
SINGLE MOTHER HOUSEHOLDS
2.4/ 100
METRIC RATING
226th/ 347
METRIC RANK
7.6%
SINGLE MOTHER HOUSEHOLDS
0.1/ 100
METRIC RATING
274th/ 347
METRIC RANK
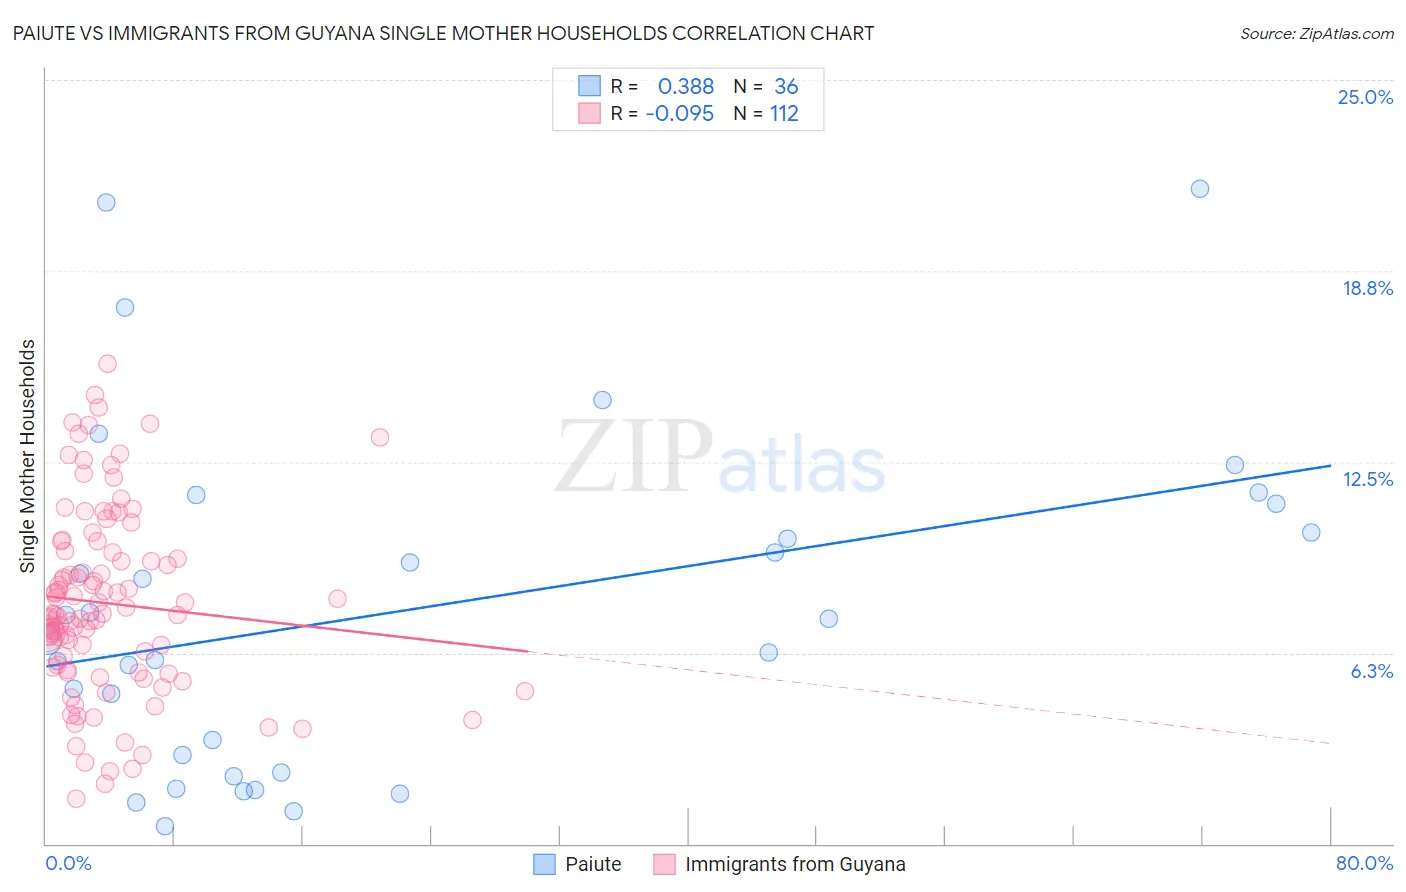
Paiute vs Immigrants from Guyana Single Mother Households Correlation Chart
The statistical analysis conducted on geographies consisting of 58,356,000 people shows a mild positive correlation between the proportion of Paiute and percentage of single mother households in the United States with a correlation coefficient (R) of 0.388 and weighted average of 7.0%. Similarly, the statistical analysis conducted on geographies consisting of 183,513,161 people shows a slight negative correlation between the proportion of Immigrants from Guyana and percentage of single mother households in the United States with a correlation coefficient (R) of -0.095 and weighted average of 7.6%, a difference of 8.8%.
Single Mother Households Correlation Summary
| Measurement | Paiute | Immigrants from Guyana |
| Minimum | 0.59% | 1.5% |
| Maximum | 21.4% | 15.7% |
| Range | 20.8% | 14.2% |
| Mean | 7.6% | 7.9% |
| Median | 7.0% | 7.5% |
| Interquartile 25% (IQ1) | 2.6% | 5.7% |
| Interquartile 75% (IQ3) | 10.7% | 9.6% |
| Interquartile Range (IQR) | 8.0% | 3.8% |
| Standard Deviation (Sample) | 5.4% | 3.0% |
| Standard Deviation (Population) | 5.3% | 3.0% |
Similar Demographics by Single Mother Households
Demographics Similar to Paiute by Single Mother Households
In terms of single mother households, the demographic groups most similar to Paiute are Kenyan (7.0%, a difference of 0.14%), Iroquois (7.0%, a difference of 0.17%), Immigrants from Kenya (7.0%, a difference of 0.34%), Sudanese (6.9%, a difference of 0.68%), and Immigrants from Sudan (6.9%, a difference of 0.96%).
| Demographics | Rating | Rank | Single Mother Households |
| Immigrants | Immigrants | 4.3 /100 | #219 | Tragic 6.8% |
| Immigrants | Thailand | 4.0 /100 | #220 | Tragic 6.9% |
| French American Indians | 3.7 /100 | #221 | Tragic 6.9% |
| Immigrants | Bangladesh | 3.7 /100 | #222 | Tragic 6.9% |
| Immigrants | Micronesia | 3.6 /100 | #223 | Tragic 6.9% |
| Immigrants | Sudan | 3.5 /100 | #224 | Tragic 6.9% |
| Sudanese | 3.1 /100 | #225 | Tragic 6.9% |
| Paiute | 2.4 /100 | #226 | Tragic 7.0% |
| Kenyans | 2.3 /100 | #227 | Tragic 7.0% |
| Iroquois | 2.2 /100 | #228 | Tragic 7.0% |
| Immigrants | Kenya | 2.1 /100 | #229 | Tragic 7.0% |
| Creek | 1.6 /100 | #230 | Tragic 7.0% |
| Spanish Americans | 1.6 /100 | #231 | Tragic 7.0% |
| Comanche | 1.5 /100 | #232 | Tragic 7.0% |
| Choctaw | 1.4 /100 | #233 | Tragic 7.0% |
Demographics Similar to Immigrants from Guyana by Single Mother Households
In terms of single mother households, the demographic groups most similar to Immigrants from Guyana are Belizean (7.6%, a difference of 0.040%), Central American Indian (7.6%, a difference of 0.10%), Salvadoran (7.5%, a difference of 0.36%), Immigrants from the Azores (7.5%, a difference of 0.36%), and Immigrants from Cuba (7.5%, a difference of 0.45%).
| Demographics | Rating | Rank | Single Mother Households |
| Blackfeet | 0.1 /100 | #267 | Tragic 7.5% |
| Indonesians | 0.1 /100 | #268 | Tragic 7.5% |
| Somalis | 0.1 /100 | #269 | Tragic 7.5% |
| Immigrants | Cuba | 0.1 /100 | #270 | Tragic 7.5% |
| Salvadorans | 0.1 /100 | #271 | Tragic 7.5% |
| Immigrants | Azores | 0.1 /100 | #272 | Tragic 7.5% |
| Belizeans | 0.1 /100 | #273 | Tragic 7.6% |
| Immigrants | Guyana | 0.1 /100 | #274 | Tragic 7.6% |
| Central American Indians | 0.1 /100 | #275 | Tragic 7.6% |
| Guyanese | 0.1 /100 | #276 | Tragic 7.6% |
| Immigrants | Trinidad and Tobago | 0.1 /100 | #277 | Tragic 7.6% |
| Central Americans | 0.1 /100 | #278 | Tragic 7.6% |
| Immigrants | El Salvador | 0.0 /100 | #279 | Tragic 7.6% |
| Immigrants | Sierra Leone | 0.0 /100 | #280 | Tragic 7.7% |
| Immigrants | Laos | 0.0 /100 | #281 | Tragic 7.7% |