Indonesian vs Immigrants from Austria Single Mother Households
COMPARE
Indonesian
Immigrants from Austria
Single Mother Households
Single Mother Households Comparison
Indonesians
Immigrants from Austria
7.5%
SINGLE MOTHER HOUSEHOLDS
0.1/ 100
METRIC RATING
268th/ 347
METRIC RANK
5.2%
SINGLE MOTHER HOUSEHOLDS
99.8/ 100
METRIC RATING
23rd/ 347
METRIC RANK
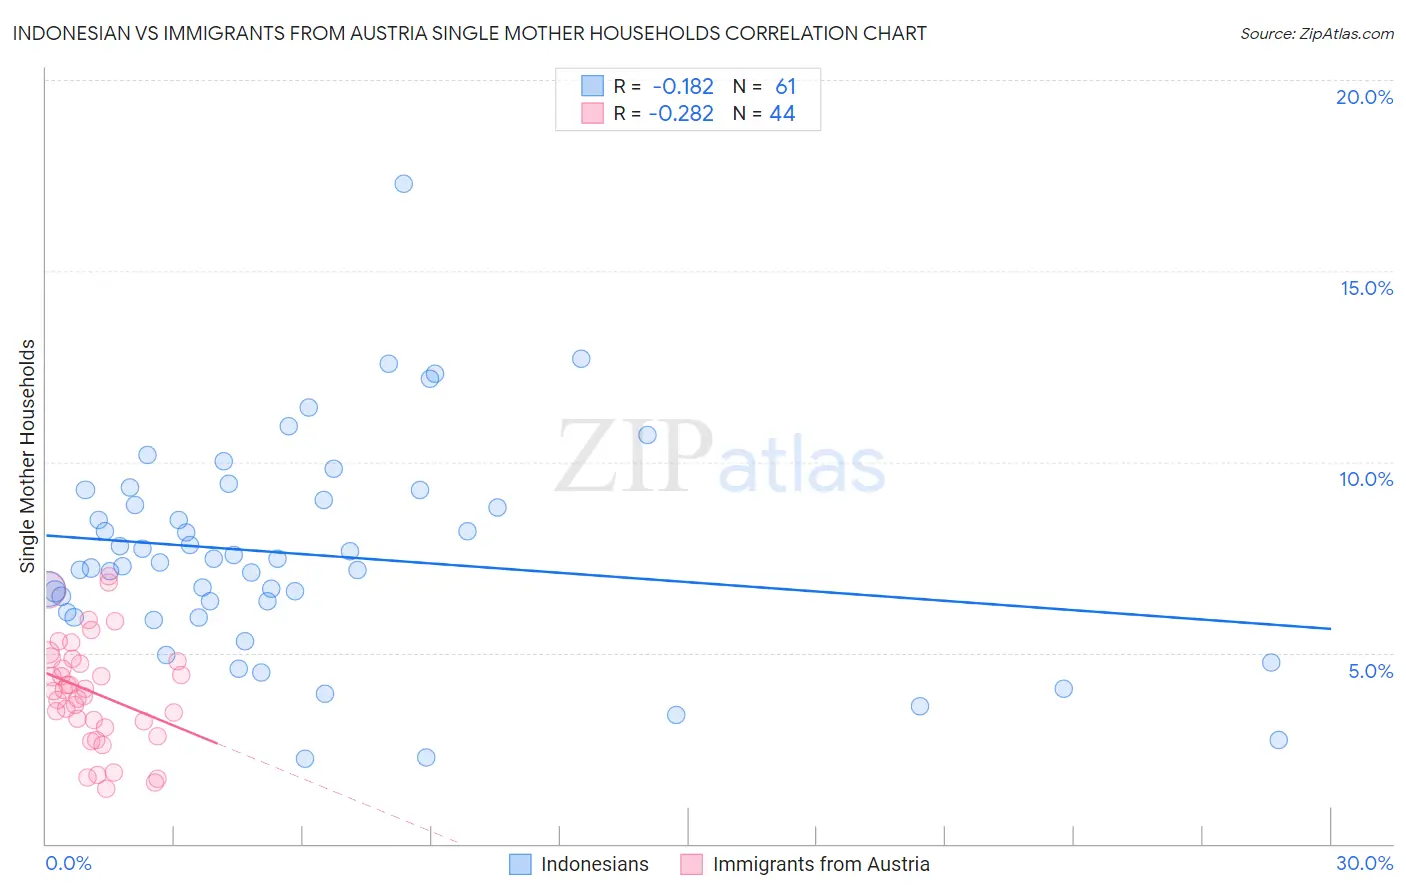
Indonesian vs Immigrants from Austria Single Mother Households Correlation Chart
The statistical analysis conducted on geographies consisting of 162,449,880 people shows a poor negative correlation between the proportion of Indonesians and percentage of single mother households in the United States with a correlation coefficient (R) of -0.182 and weighted average of 7.5%. Similarly, the statistical analysis conducted on geographies consisting of 167,548,471 people shows a weak negative correlation between the proportion of Immigrants from Austria and percentage of single mother households in the United States with a correlation coefficient (R) of -0.282 and weighted average of 5.2%, a difference of 43.1%.
Single Mother Households Correlation Summary
| Measurement | Indonesian | Immigrants from Austria |
| Minimum | 2.2% | 1.5% |
| Maximum | 17.3% | 7.0% |
| Range | 15.0% | 5.6% |
| Mean | 7.6% | 4.0% |
| Median | 7.4% | 4.0% |
| Interquartile 25% (IQ1) | 6.0% | 3.1% |
| Interquartile 75% (IQ3) | 9.1% | 4.8% |
| Interquartile Range (IQR) | 3.1% | 1.7% |
| Standard Deviation (Sample) | 2.8% | 1.4% |
| Standard Deviation (Population) | 2.7% | 1.4% |
Similar Demographics by Single Mother Households
Demographics Similar to Indonesians by Single Mother Households
In terms of single mother households, the demographic groups most similar to Indonesians are Blackfeet (7.5%, a difference of 0.040%), Nepalese (7.5%, a difference of 0.38%), Somali (7.5%, a difference of 0.41%), Crow (7.4%, a difference of 0.48%), and Immigrants from Cuba (7.5%, a difference of 0.58%).
| Demographics | Rating | Rank | Single Mother Households |
| Japanese | 0.2 /100 | #261 | Tragic 7.4% |
| Immigrants | Somalia | 0.2 /100 | #262 | Tragic 7.4% |
| Immigrants | Nicaragua | 0.2 /100 | #263 | Tragic 7.4% |
| Yaqui | 0.1 /100 | #264 | Tragic 7.4% |
| Crow | 0.1 /100 | #265 | Tragic 7.4% |
| Nepalese | 0.1 /100 | #266 | Tragic 7.5% |
| Blackfeet | 0.1 /100 | #267 | Tragic 7.5% |
| Indonesians | 0.1 /100 | #268 | Tragic 7.5% |
| Somalis | 0.1 /100 | #269 | Tragic 7.5% |
| Immigrants | Cuba | 0.1 /100 | #270 | Tragic 7.5% |
| Salvadorans | 0.1 /100 | #271 | Tragic 7.5% |
| Immigrants | Azores | 0.1 /100 | #272 | Tragic 7.5% |
| Belizeans | 0.1 /100 | #273 | Tragic 7.6% |
| Immigrants | Guyana | 0.1 /100 | #274 | Tragic 7.6% |
| Central American Indians | 0.1 /100 | #275 | Tragic 7.6% |
Demographics Similar to Immigrants from Austria by Single Mother Households
In terms of single mother households, the demographic groups most similar to Immigrants from Austria are Thai (5.2%, a difference of 0.050%), Armenian (5.2%, a difference of 0.060%), Immigrants from Japan (5.2%, a difference of 0.39%), Immigrants from Lithuania (5.3%, a difference of 0.42%), and Eastern European (5.2%, a difference of 0.77%).
| Demographics | Rating | Rank | Single Mother Households |
| Indians (Asian) | 99.9 /100 | #16 | Exceptional 5.1% |
| Soviet Union | 99.9 /100 | #17 | Exceptional 5.1% |
| Immigrants | Armenia | 99.9 /100 | #18 | Exceptional 5.2% |
| Chinese | 99.9 /100 | #19 | Exceptional 5.2% |
| Maltese | 99.9 /100 | #20 | Exceptional 5.2% |
| Eastern Europeans | 99.8 /100 | #21 | Exceptional 5.2% |
| Thais | 99.8 /100 | #22 | Exceptional 5.2% |
| Immigrants | Austria | 99.8 /100 | #23 | Exceptional 5.2% |
| Armenians | 99.8 /100 | #24 | Exceptional 5.2% |
| Immigrants | Japan | 99.8 /100 | #25 | Exceptional 5.2% |
| Immigrants | Lithuania | 99.8 /100 | #26 | Exceptional 5.3% |
| Bhutanese | 99.7 /100 | #27 | Exceptional 5.3% |
| Russians | 99.7 /100 | #28 | Exceptional 5.3% |
| Latvians | 99.7 /100 | #29 | Exceptional 5.3% |
| Burmese | 99.7 /100 | #30 | Exceptional 5.3% |