Russian vs Immigrants from Austria Single Mother Households
COMPARE
Russian
Immigrants from Austria
Single Mother Households
Single Mother Households Comparison
Russians
Immigrants from Austria
5.3%
SINGLE MOTHER HOUSEHOLDS
99.7/ 100
METRIC RATING
28th/ 347
METRIC RANK
5.2%
SINGLE MOTHER HOUSEHOLDS
99.8/ 100
METRIC RATING
23rd/ 347
METRIC RANK
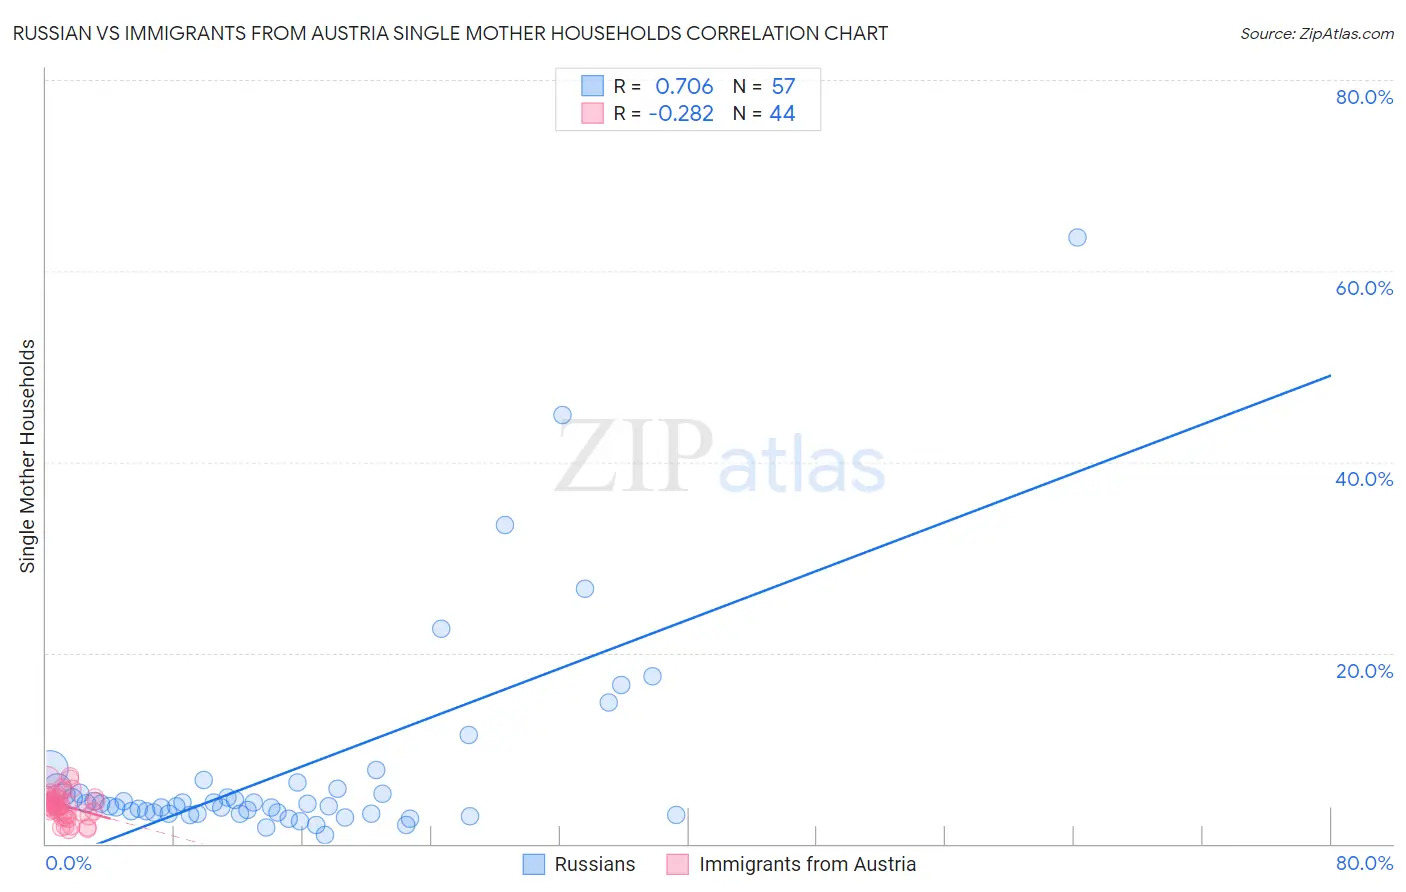
Russian vs Immigrants from Austria Single Mother Households Correlation Chart
The statistical analysis conducted on geographies consisting of 509,106,631 people shows a strong positive correlation between the proportion of Russians and percentage of single mother households in the United States with a correlation coefficient (R) of 0.706 and weighted average of 5.3%. Similarly, the statistical analysis conducted on geographies consisting of 167,548,471 people shows a weak negative correlation between the proportion of Immigrants from Austria and percentage of single mother households in the United States with a correlation coefficient (R) of -0.282 and weighted average of 5.2%, a difference of 1.0%.
Single Mother Households Correlation Summary
| Measurement | Russian | Immigrants from Austria |
| Minimum | 0.89% | 1.5% |
| Maximum | 63.5% | 7.0% |
| Range | 62.6% | 5.6% |
| Mean | 7.8% | 4.0% |
| Median | 4.2% | 4.0% |
| Interquartile 25% (IQ1) | 3.2% | 3.1% |
| Interquartile 75% (IQ3) | 5.8% | 4.8% |
| Interquartile Range (IQR) | 2.6% | 1.7% |
| Standard Deviation (Sample) | 11.0% | 1.4% |
| Standard Deviation (Population) | 10.9% | 1.4% |
Demographics Similar to Russians and Immigrants from Austria by Single Mother Households
In terms of single mother households, the demographic groups most similar to Russians are Latvian (5.3%, a difference of 0.010%), Burmese (5.3%, a difference of 0.080%), Immigrants from Korea (5.3%, a difference of 0.080%), Cambodian (5.3%, a difference of 0.090%), and Bhutanese (5.3%, a difference of 0.10%). Similarly, the demographic groups most similar to Immigrants from Austria are Thai (5.2%, a difference of 0.050%), Armenian (5.2%, a difference of 0.060%), Immigrants from Japan (5.2%, a difference of 0.39%), Immigrants from Lithuania (5.3%, a difference of 0.42%), and Eastern European (5.2%, a difference of 0.77%).
| Demographics | Rating | Rank | Single Mother Households |
| Immigrants | Eastern Asia | 99.9 /100 | #15 | Exceptional 5.1% |
| Indians (Asian) | 99.9 /100 | #16 | Exceptional 5.1% |
| Soviet Union | 99.9 /100 | #17 | Exceptional 5.1% |
| Immigrants | Armenia | 99.9 /100 | #18 | Exceptional 5.2% |
| Chinese | 99.9 /100 | #19 | Exceptional 5.2% |
| Maltese | 99.9 /100 | #20 | Exceptional 5.2% |
| Eastern Europeans | 99.8 /100 | #21 | Exceptional 5.2% |
| Thais | 99.8 /100 | #22 | Exceptional 5.2% |
| Immigrants | Austria | 99.8 /100 | #23 | Exceptional 5.2% |
| Armenians | 99.8 /100 | #24 | Exceptional 5.2% |
| Immigrants | Japan | 99.8 /100 | #25 | Exceptional 5.2% |
| Immigrants | Lithuania | 99.8 /100 | #26 | Exceptional 5.3% |
| Bhutanese | 99.7 /100 | #27 | Exceptional 5.3% |
| Russians | 99.7 /100 | #28 | Exceptional 5.3% |
| Latvians | 99.7 /100 | #29 | Exceptional 5.3% |
| Burmese | 99.7 /100 | #30 | Exceptional 5.3% |
| Immigrants | Korea | 99.7 /100 | #31 | Exceptional 5.3% |
| Cambodians | 99.7 /100 | #32 | Exceptional 5.3% |
| Immigrants | Switzerland | 99.7 /100 | #33 | Exceptional 5.3% |
| Bulgarians | 99.7 /100 | #34 | Exceptional 5.3% |
| Immigrants | Northern Europe | 99.7 /100 | #35 | Exceptional 5.3% |