West Indian vs Lithuanian Currently Married
COMPARE
West Indian
Lithuanian
Currently Married
Currently Married Comparison
West Indians
Lithuanians
41.3%
CURRENTLY MARRIED
0.0/ 100
METRIC RATING
314th/ 347
METRIC RANK
49.0%
CURRENTLY MARRIED
99.6/ 100
METRIC RATING
24th/ 347
METRIC RANK
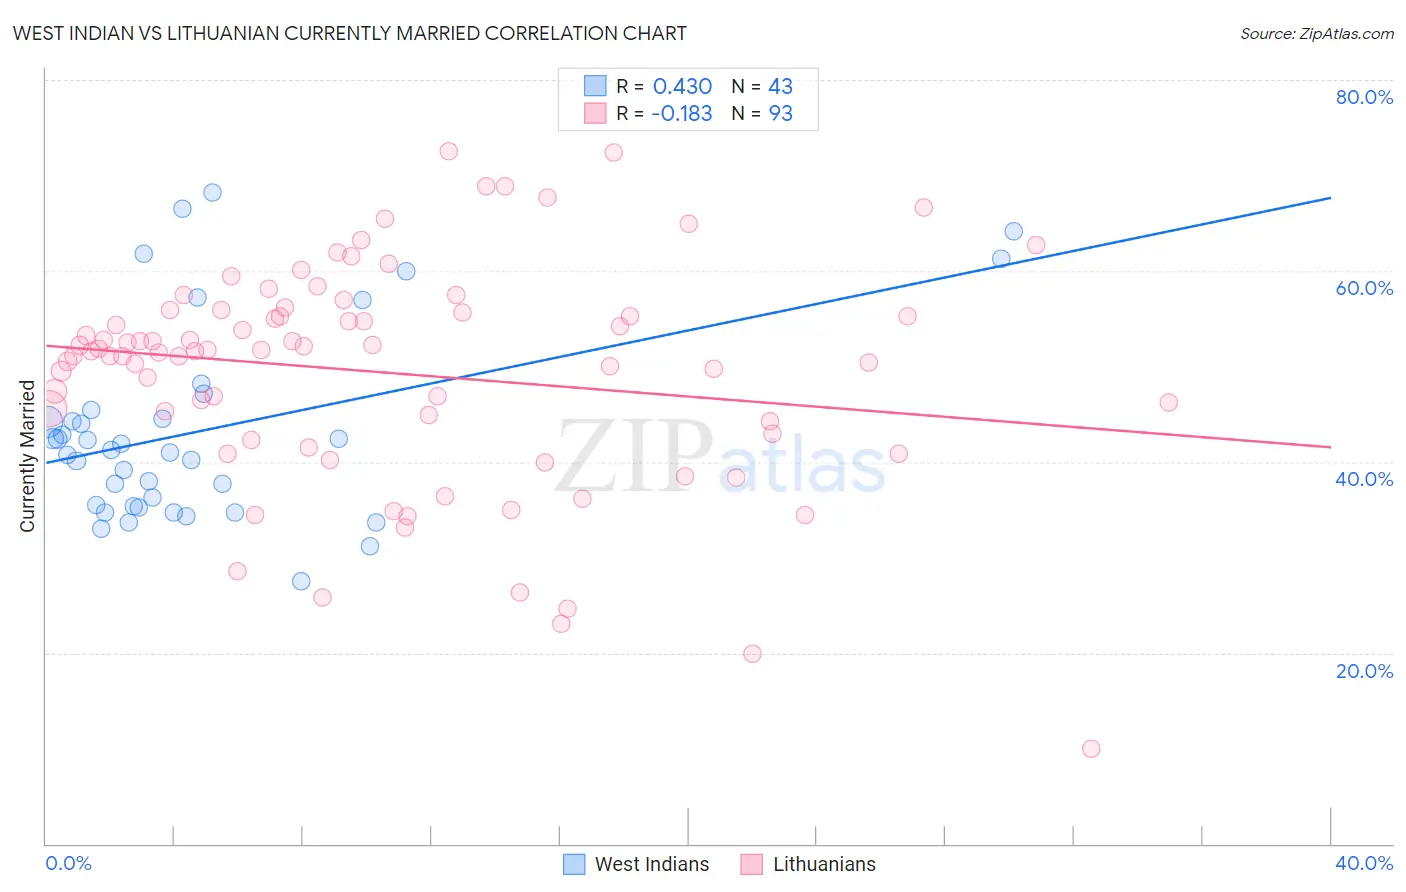
West Indian vs Lithuanian Currently Married Correlation Chart
The statistical analysis conducted on geographies consisting of 254,034,527 people shows a moderate positive correlation between the proportion of West Indians and percentage of population currently married in the United States with a correlation coefficient (R) of 0.430 and weighted average of 41.3%. Similarly, the statistical analysis conducted on geographies consisting of 421,888,546 people shows a poor negative correlation between the proportion of Lithuanians and percentage of population currently married in the United States with a correlation coefficient (R) of -0.183 and weighted average of 49.0%, a difference of 18.6%.
Currently Married Correlation Summary
| Measurement | West Indian | Lithuanian |
| Minimum | 27.5% | 10.0% |
| Maximum | 68.2% | 72.5% |
| Range | 40.7% | 62.5% |
| Mean | 43.3% | 49.3% |
| Median | 41.3% | 51.6% |
| Interquartile 25% (IQ1) | 35.3% | 42.6% |
| Interquartile 75% (IQ3) | 45.4% | 55.8% |
| Interquartile Range (IQR) | 10.0% | 13.2% |
| Standard Deviation (Sample) | 10.2% | 11.7% |
| Standard Deviation (Population) | 10.1% | 11.7% |
Similar Demographics by Currently Married
Demographics Similar to West Indians by Currently Married
In terms of currently married, the demographic groups most similar to West Indians are Jamaican (41.4%, a difference of 0.080%), Inupiat (41.3%, a difference of 0.090%), Immigrants from Caribbean (41.3%, a difference of 0.15%), Haitian (41.3%, a difference of 0.17%), and Bahamian (41.2%, a difference of 0.35%).
| Demographics | Rating | Rank | Currently Married |
| Africans | 0.0 /100 | #307 | Tragic 41.8% |
| Immigrants | Belize | 0.0 /100 | #308 | Tragic 41.8% |
| Immigrants | Liberia | 0.0 /100 | #309 | Tragic 41.8% |
| Guyanese | 0.0 /100 | #310 | Tragic 41.6% |
| Trinidadians and Tobagonians | 0.0 /100 | #311 | Tragic 41.5% |
| Somalis | 0.0 /100 | #312 | Tragic 41.5% |
| Jamaicans | 0.0 /100 | #313 | Tragic 41.4% |
| West Indians | 0.0 /100 | #314 | Tragic 41.3% |
| Inupiat | 0.0 /100 | #315 | Tragic 41.3% |
| Immigrants | Caribbean | 0.0 /100 | #316 | Tragic 41.3% |
| Haitians | 0.0 /100 | #317 | Tragic 41.3% |
| Bahamians | 0.0 /100 | #318 | Tragic 41.2% |
| Immigrants | Somalia | 0.0 /100 | #319 | Tragic 41.2% |
| Immigrants | Jamaica | 0.0 /100 | #320 | Tragic 41.1% |
| Immigrants | Congo | 0.0 /100 | #321 | Tragic 41.1% |
Demographics Similar to Lithuanians by Currently Married
In terms of currently married, the demographic groups most similar to Lithuanians are Maltese (49.0%, a difference of 0.010%), Immigrants from Korea (49.0%, a difference of 0.060%), Immigrants from Pakistan (49.1%, a difference of 0.11%), Burmese (48.9%, a difference of 0.13%), and Welsh (48.9%, a difference of 0.17%).
| Demographics | Rating | Rank | Currently Married |
| Scandinavians | 99.9 /100 | #17 | Exceptional 49.5% |
| Immigrants | Scotland | 99.8 /100 | #18 | Exceptional 49.3% |
| Europeans | 99.8 /100 | #19 | Exceptional 49.3% |
| Luxembourgers | 99.8 /100 | #20 | Exceptional 49.3% |
| Scottish | 99.8 /100 | #21 | Exceptional 49.2% |
| Bulgarians | 99.7 /100 | #22 | Exceptional 49.1% |
| Immigrants | Pakistan | 99.7 /100 | #23 | Exceptional 49.1% |
| Lithuanians | 99.6 /100 | #24 | Exceptional 49.0% |
| Maltese | 99.6 /100 | #25 | Exceptional 49.0% |
| Immigrants | Korea | 99.6 /100 | #26 | Exceptional 49.0% |
| Burmese | 99.6 /100 | #27 | Exceptional 48.9% |
| Welsh | 99.5 /100 | #28 | Exceptional 48.9% |
| Croatians | 99.5 /100 | #29 | Exceptional 48.9% |
| Eastern Europeans | 99.5 /100 | #30 | Exceptional 48.9% |
| Poles | 99.5 /100 | #31 | Exceptional 48.9% |