West Indian vs Immigrants from Romania Currently Married
COMPARE
West Indian
Immigrants from Romania
Currently Married
Currently Married Comparison
West Indians
Immigrants from Romania
41.3%
CURRENTLY MARRIED
0.0/ 100
METRIC RATING
314th/ 347
METRIC RANK
48.4%
CURRENTLY MARRIED
98.5/ 100
METRIC RATING
60th/ 347
METRIC RANK
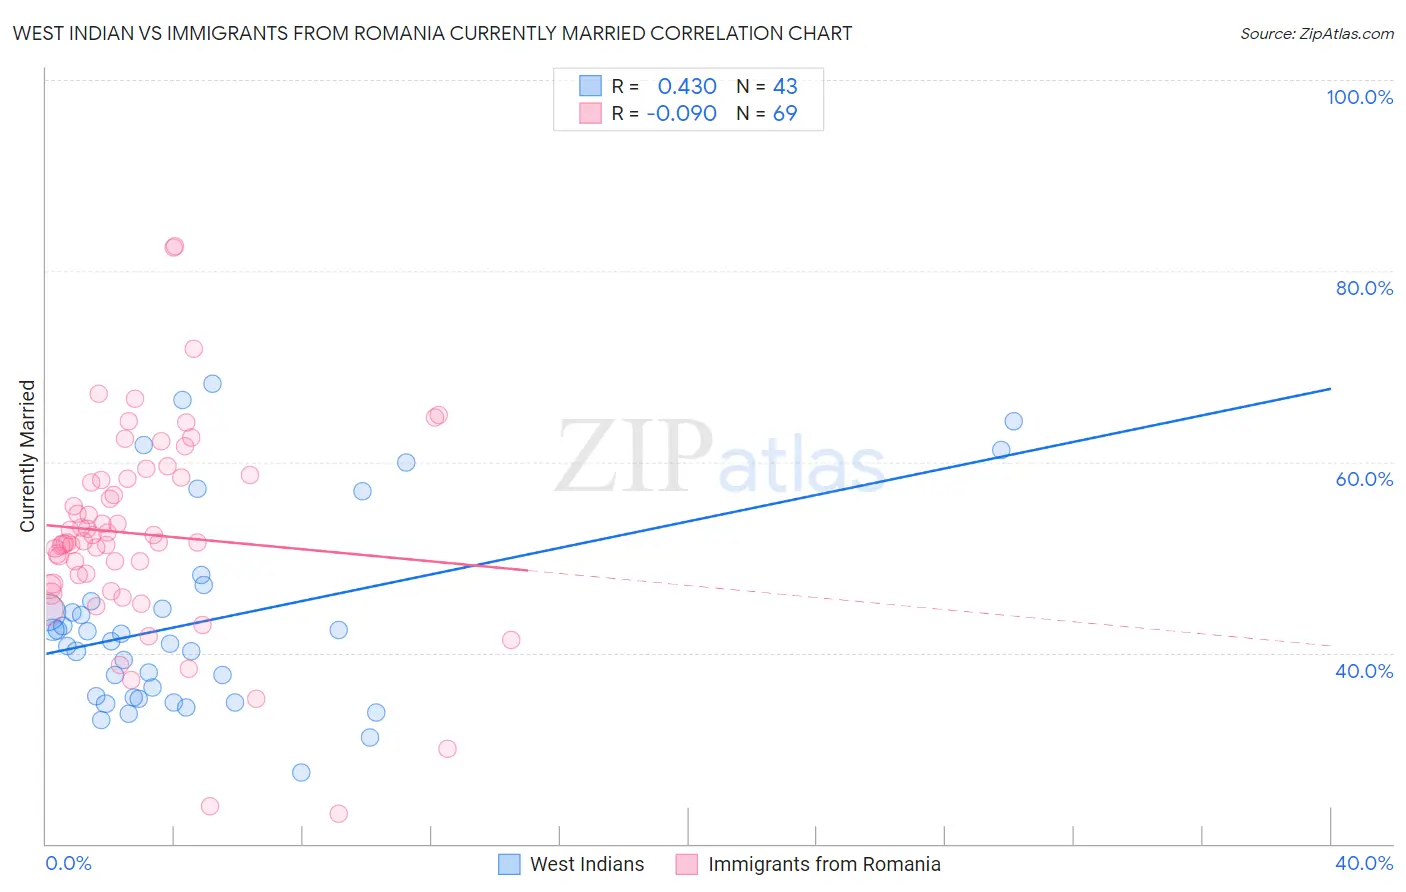
West Indian vs Immigrants from Romania Currently Married Correlation Chart
The statistical analysis conducted on geographies consisting of 254,034,527 people shows a moderate positive correlation between the proportion of West Indians and percentage of population currently married in the United States with a correlation coefficient (R) of 0.430 and weighted average of 41.3%. Similarly, the statistical analysis conducted on geographies consisting of 257,009,333 people shows a slight negative correlation between the proportion of Immigrants from Romania and percentage of population currently married in the United States with a correlation coefficient (R) of -0.090 and weighted average of 48.4%, a difference of 17.2%.
Currently Married Correlation Summary
| Measurement | West Indian | Immigrants from Romania |
| Minimum | 27.5% | 23.2% |
| Maximum | 68.2% | 82.6% |
| Range | 40.7% | 59.4% |
| Mean | 43.3% | 52.4% |
| Median | 41.3% | 51.6% |
| Interquartile 25% (IQ1) | 35.3% | 47.1% |
| Interquartile 75% (IQ3) | 45.4% | 58.3% |
| Interquartile Range (IQR) | 10.0% | 11.2% |
| Standard Deviation (Sample) | 10.2% | 10.7% |
| Standard Deviation (Population) | 10.1% | 10.6% |
Similar Demographics by Currently Married
Demographics Similar to West Indians by Currently Married
In terms of currently married, the demographic groups most similar to West Indians are Jamaican (41.4%, a difference of 0.080%), Inupiat (41.3%, a difference of 0.090%), Immigrants from Caribbean (41.3%, a difference of 0.15%), Haitian (41.3%, a difference of 0.17%), and Bahamian (41.2%, a difference of 0.35%).
| Demographics | Rating | Rank | Currently Married |
| Africans | 0.0 /100 | #307 | Tragic 41.8% |
| Immigrants | Belize | 0.0 /100 | #308 | Tragic 41.8% |
| Immigrants | Liberia | 0.0 /100 | #309 | Tragic 41.8% |
| Guyanese | 0.0 /100 | #310 | Tragic 41.6% |
| Trinidadians and Tobagonians | 0.0 /100 | #311 | Tragic 41.5% |
| Somalis | 0.0 /100 | #312 | Tragic 41.5% |
| Jamaicans | 0.0 /100 | #313 | Tragic 41.4% |
| West Indians | 0.0 /100 | #314 | Tragic 41.3% |
| Inupiat | 0.0 /100 | #315 | Tragic 41.3% |
| Immigrants | Caribbean | 0.0 /100 | #316 | Tragic 41.3% |
| Haitians | 0.0 /100 | #317 | Tragic 41.3% |
| Bahamians | 0.0 /100 | #318 | Tragic 41.2% |
| Immigrants | Somalia | 0.0 /100 | #319 | Tragic 41.2% |
| Immigrants | Jamaica | 0.0 /100 | #320 | Tragic 41.1% |
| Immigrants | Congo | 0.0 /100 | #321 | Tragic 41.1% |
Demographics Similar to Immigrants from Romania by Currently Married
In terms of currently married, the demographic groups most similar to Immigrants from Romania are Immigrants from Ireland (48.4%, a difference of 0.010%), Romanian (48.4%, a difference of 0.010%), Asian (48.4%, a difference of 0.010%), French (48.4%, a difference of 0.040%), and Immigrants from Netherlands (48.5%, a difference of 0.090%).
| Demographics | Rating | Rank | Currently Married |
| Immigrants | Austria | 98.8 /100 | #53 | Exceptional 48.5% |
| Immigrants | Moldova | 98.7 /100 | #54 | Exceptional 48.5% |
| Immigrants | North Macedonia | 98.7 /100 | #55 | Exceptional 48.5% |
| Latvians | 98.7 /100 | #56 | Exceptional 48.5% |
| Immigrants | Netherlands | 98.6 /100 | #57 | Exceptional 48.5% |
| French | 98.6 /100 | #58 | Exceptional 48.4% |
| Immigrants | Ireland | 98.5 /100 | #59 | Exceptional 48.4% |
| Immigrants | Romania | 98.5 /100 | #60 | Exceptional 48.4% |
| Romanians | 98.5 /100 | #61 | Exceptional 48.4% |
| Asians | 98.5 /100 | #62 | Exceptional 48.4% |
| Slavs | 98.3 /100 | #63 | Exceptional 48.4% |
| Immigrants | Czechoslovakia | 98.3 /100 | #64 | Exceptional 48.4% |
| Ukrainians | 98.3 /100 | #65 | Exceptional 48.4% |
| Tongans | 98.2 /100 | #66 | Exceptional 48.3% |
| Slovaks | 98.2 /100 | #67 | Exceptional 48.3% |