West Indian vs Honduran Currently Married
COMPARE
West Indian
Honduran
Currently Married
Currently Married Comparison
West Indians
Hondurans
41.3%
CURRENTLY MARRIED
0.0/ 100
METRIC RATING
314th/ 347
METRIC RANK
42.5%
CURRENTLY MARRIED
0.0/ 100
METRIC RATING
294th/ 347
METRIC RANK
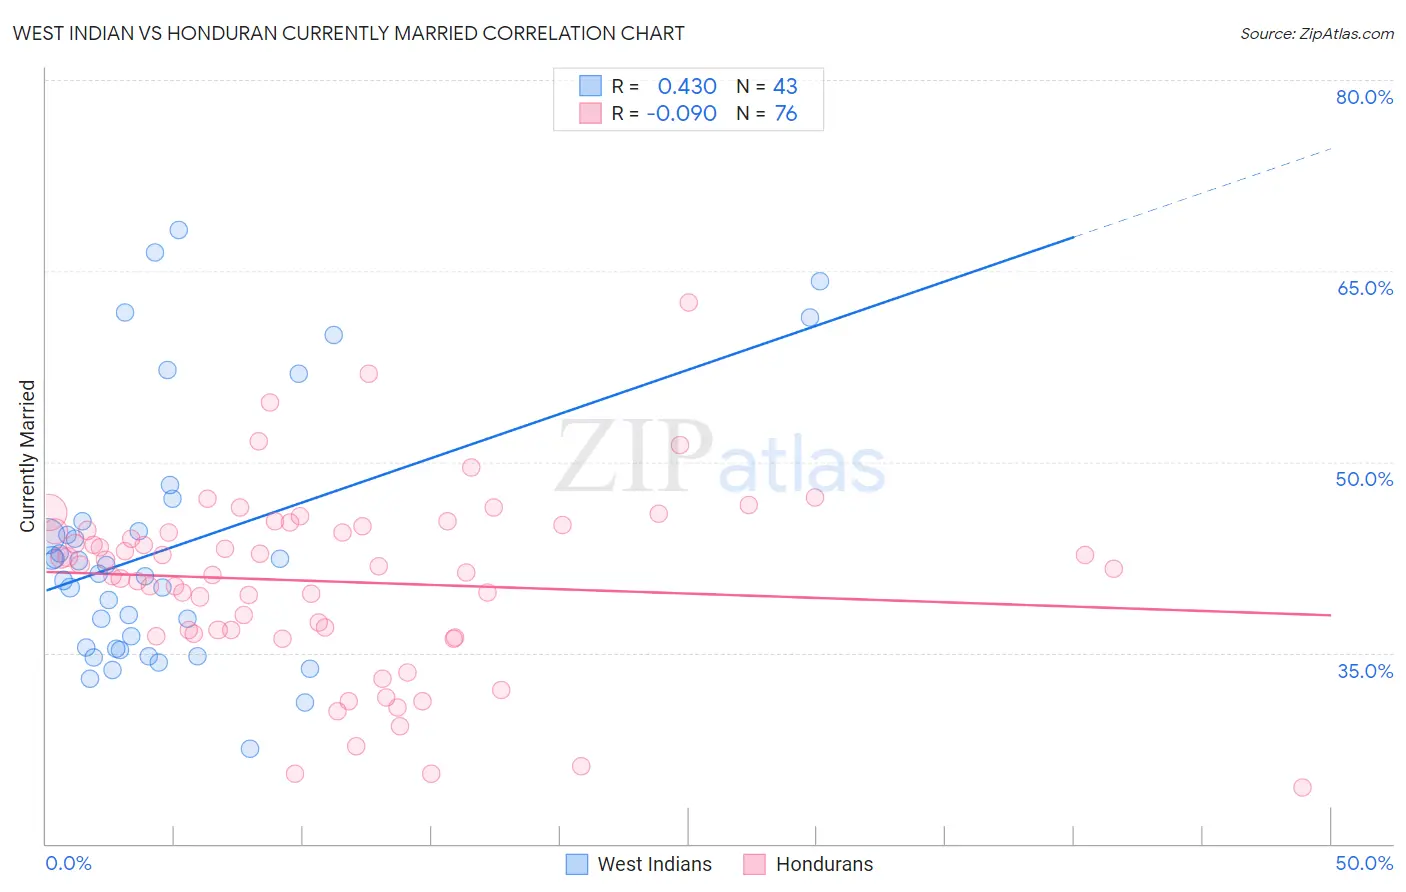
West Indian vs Honduran Currently Married Correlation Chart
The statistical analysis conducted on geographies consisting of 254,034,527 people shows a moderate positive correlation between the proportion of West Indians and percentage of population currently married in the United States with a correlation coefficient (R) of 0.430 and weighted average of 41.3%. Similarly, the statistical analysis conducted on geographies consisting of 357,812,977 people shows a slight negative correlation between the proportion of Hondurans and percentage of population currently married in the United States with a correlation coefficient (R) of -0.090 and weighted average of 42.5%, a difference of 2.9%.
Currently Married Correlation Summary
| Measurement | West Indian | Honduran |
| Minimum | 27.5% | 24.4% |
| Maximum | 68.2% | 62.5% |
| Range | 40.7% | 38.1% |
| Mean | 43.3% | 40.6% |
| Median | 41.3% | 41.7% |
| Interquartile 25% (IQ1) | 35.3% | 36.6% |
| Interquartile 75% (IQ3) | 45.4% | 44.7% |
| Interquartile Range (IQR) | 10.0% | 8.1% |
| Standard Deviation (Sample) | 10.2% | 7.1% |
| Standard Deviation (Population) | 10.1% | 7.1% |
Demographics Similar to West Indians and Hondurans by Currently Married
In terms of currently married, the demographic groups most similar to West Indians are Jamaican (41.4%, a difference of 0.080%), Somali (41.5%, a difference of 0.36%), Trinidadian and Tobagonian (41.5%, a difference of 0.55%), Guyanese (41.6%, a difference of 0.69%), and Immigrants from Liberia (41.8%, a difference of 1.1%). Similarly, the demographic groups most similar to Hondurans are Immigrants from Western Africa (42.4%, a difference of 0.33%), Menominee (42.3%, a difference of 0.54%), Cheyenne (42.2%, a difference of 0.65%), Immigrants from Honduras (42.2%, a difference of 0.74%), and Liberian (42.2%, a difference of 0.77%).
| Demographics | Rating | Rank | Currently Married |
| Hondurans | 0.0 /100 | #294 | Tragic 42.5% |
| Immigrants | Western Africa | 0.0 /100 | #295 | Tragic 42.4% |
| Menominee | 0.0 /100 | #296 | Tragic 42.3% |
| Cheyenne | 0.0 /100 | #297 | Tragic 42.2% |
| Immigrants | Honduras | 0.0 /100 | #298 | Tragic 42.2% |
| Liberians | 0.0 /100 | #299 | Tragic 42.2% |
| Belizeans | 0.0 /100 | #300 | Tragic 42.2% |
| Immigrants | Yemen | 0.0 /100 | #301 | Tragic 42.1% |
| Immigrants | Zaire | 0.0 /100 | #302 | Tragic 42.0% |
| Sioux | 0.0 /100 | #303 | Tragic 41.9% |
| Immigrants | Bahamas | 0.0 /100 | #304 | Tragic 41.9% |
| Immigrants | Trinidad and Tobago | 0.0 /100 | #305 | Tragic 41.9% |
| Immigrants | Guyana | 0.0 /100 | #306 | Tragic 41.9% |
| Africans | 0.0 /100 | #307 | Tragic 41.8% |
| Immigrants | Belize | 0.0 /100 | #308 | Tragic 41.8% |
| Immigrants | Liberia | 0.0 /100 | #309 | Tragic 41.8% |
| Guyanese | 0.0 /100 | #310 | Tragic 41.6% |
| Trinidadians and Tobagonians | 0.0 /100 | #311 | Tragic 41.5% |
| Somalis | 0.0 /100 | #312 | Tragic 41.5% |
| Jamaicans | 0.0 /100 | #313 | Tragic 41.4% |
| West Indians | 0.0 /100 | #314 | Tragic 41.3% |