West Indian vs Immigrants from Armenia Births to Unmarried Women
COMPARE
West Indian
Immigrants from Armenia
Births to Unmarried Women
Births to Unmarried Women Comparison
West Indians
Immigrants from Armenia
37.3%
BIRTHS TO UNMARRIED WOMEN
0.1/ 100
METRIC RATING
279th/ 347
METRIC RANK
26.1%
BIRTHS TO UNMARRIED WOMEN
99.9/ 100
METRIC RATING
18th/ 347
METRIC RANK
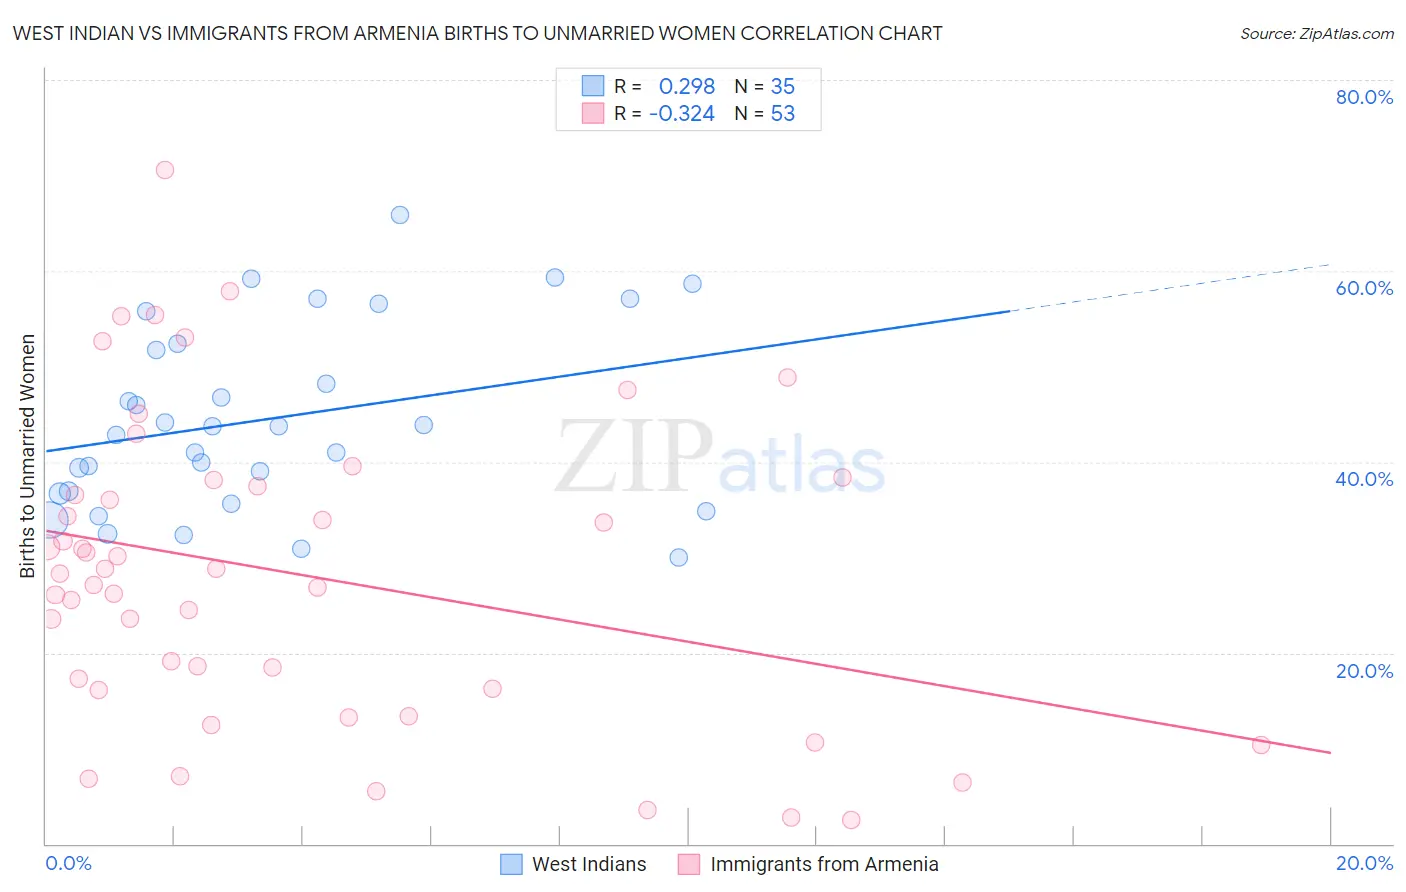
West Indian vs Immigrants from Armenia Births to Unmarried Women Correlation Chart
The statistical analysis conducted on geographies consisting of 244,812,530 people shows a weak positive correlation between the proportion of West Indians and percentage of births to unmarried women in the United States with a correlation coefficient (R) of 0.298 and weighted average of 37.3%. Similarly, the statistical analysis conducted on geographies consisting of 94,792,248 people shows a mild negative correlation between the proportion of Immigrants from Armenia and percentage of births to unmarried women in the United States with a correlation coefficient (R) of -0.324 and weighted average of 26.1%, a difference of 43.0%.
Births to Unmarried Women Correlation Summary
| Measurement | West Indian | Immigrants from Armenia |
| Minimum | 30.0% | 2.5% |
| Maximum | 65.8% | 70.6% |
| Range | 35.8% | 68.1% |
| Mean | 44.5% | 28.3% |
| Median | 43.7% | 28.3% |
| Interquartile 25% (IQ1) | 36.7% | 16.1% |
| Interquartile 75% (IQ3) | 52.4% | 37.8% |
| Interquartile Range (IQR) | 15.7% | 21.7% |
| Standard Deviation (Sample) | 9.6% | 16.0% |
| Standard Deviation (Population) | 9.5% | 15.8% |
Similar Demographics by Births to Unmarried Women
Demographics Similar to West Indians by Births to Unmarried Women
In terms of births to unmarried women, the demographic groups most similar to West Indians are Immigrants from St. Vincent and the Grenadines (37.3%, a difference of 0.12%), Immigrants from Belize (37.3%, a difference of 0.13%), Liberian (37.4%, a difference of 0.30%), Immigrants from Latin America (37.1%, a difference of 0.33%), and Spanish American Indian (37.4%, a difference of 0.38%).
| Demographics | Rating | Rank | Births to Unmarried Women |
| Choctaw | 0.1 /100 | #272 | Tragic 36.9% |
| Mexicans | 0.1 /100 | #273 | Tragic 36.9% |
| Cree | 0.1 /100 | #274 | Tragic 37.0% |
| Barbadians | 0.1 /100 | #275 | Tragic 37.0% |
| Belizeans | 0.1 /100 | #276 | Tragic 37.0% |
| Guatemalans | 0.1 /100 | #277 | Tragic 37.1% |
| Immigrants | Latin America | 0.1 /100 | #278 | Tragic 37.1% |
| West Indians | 0.1 /100 | #279 | Tragic 37.3% |
| Immigrants | St. Vincent and the Grenadines | 0.1 /100 | #280 | Tragic 37.3% |
| Immigrants | Belize | 0.1 /100 | #281 | Tragic 37.3% |
| Liberians | 0.0 /100 | #282 | Tragic 37.4% |
| Spanish American Indians | 0.0 /100 | #283 | Tragic 37.4% |
| Immigrants | Central America | 0.0 /100 | #284 | Tragic 37.4% |
| Immigrants | Mexico | 0.0 /100 | #285 | Tragic 37.5% |
| Immigrants | Guatemala | 0.0 /100 | #286 | Tragic 37.5% |
Demographics Similar to Immigrants from Armenia by Births to Unmarried Women
In terms of births to unmarried women, the demographic groups most similar to Immigrants from Armenia are Armenian (26.2%, a difference of 0.58%), Immigrants from Korea (26.3%, a difference of 0.80%), Soviet Union (26.3%, a difference of 0.93%), Immigrants from Uzbekistan (25.8%, a difference of 1.1%), and Burmese (26.4%, a difference of 1.2%).
| Demographics | Rating | Rank | Births to Unmarried Women |
| Immigrants | Israel | 100.0 /100 | #11 | Exceptional 25.1% |
| Indians (Asian) | 100.0 /100 | #12 | Exceptional 25.3% |
| Iranians | 100.0 /100 | #13 | Exceptional 25.3% |
| Immigrants | Lebanon | 100.0 /100 | #14 | Exceptional 25.3% |
| Immigrants | Singapore | 100.0 /100 | #15 | Exceptional 25.6% |
| Immigrants | Belarus | 100.0 /100 | #16 | Exceptional 25.6% |
| Immigrants | Uzbekistan | 100.0 /100 | #17 | Exceptional 25.8% |
| Immigrants | Armenia | 99.9 /100 | #18 | Exceptional 26.1% |
| Armenians | 99.9 /100 | #19 | Exceptional 26.2% |
| Immigrants | Korea | 99.9 /100 | #20 | Exceptional 26.3% |
| Soviet Union | 99.9 /100 | #21 | Exceptional 26.3% |
| Burmese | 99.9 /100 | #22 | Exceptional 26.4% |
| Immigrants | Japan | 99.9 /100 | #23 | Exceptional 26.4% |
| Immigrants | Australia | 99.9 /100 | #24 | Exceptional 26.6% |
| Cambodians | 99.9 /100 | #25 | Exceptional 26.7% |