Immigrants from Argentina vs Immigrants from Armenia Births to Unmarried Women
COMPARE
Immigrants from Argentina
Immigrants from Armenia
Births to Unmarried Women
Births to Unmarried Women Comparison
Immigrants from Argentina
Immigrants from Armenia
30.1%
BIRTHS TO UNMARRIED WOMEN
88.7/ 100
METRIC RATING
122nd/ 347
METRIC RANK
26.1%
BIRTHS TO UNMARRIED WOMEN
99.9/ 100
METRIC RATING
18th/ 347
METRIC RANK
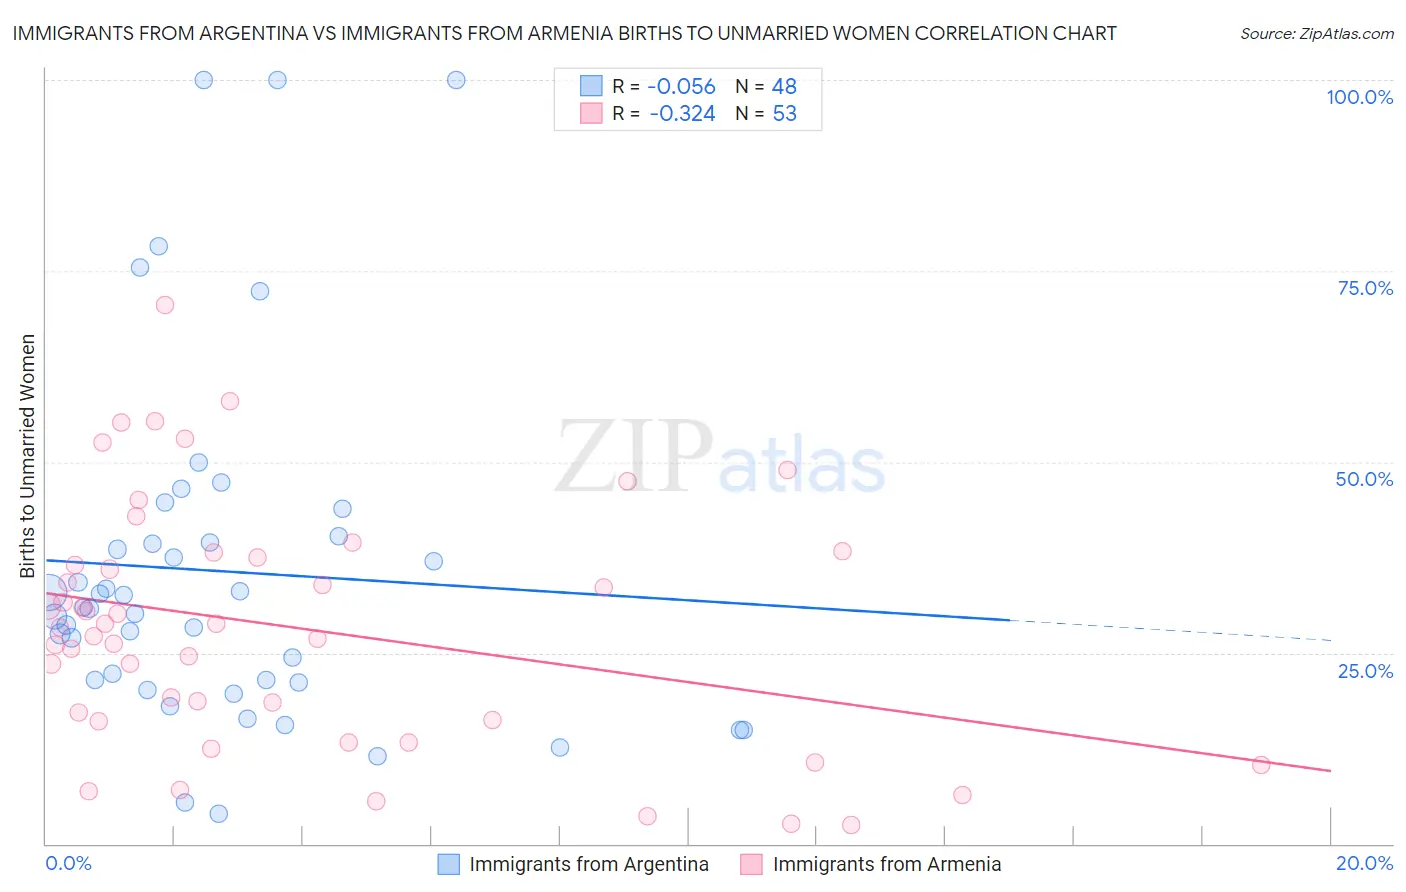
Immigrants from Argentina vs Immigrants from Armenia Births to Unmarried Women Correlation Chart
The statistical analysis conducted on geographies consisting of 249,724,782 people shows a slight negative correlation between the proportion of Immigrants from Argentina and percentage of births to unmarried women in the United States with a correlation coefficient (R) of -0.056 and weighted average of 30.1%. Similarly, the statistical analysis conducted on geographies consisting of 94,792,248 people shows a mild negative correlation between the proportion of Immigrants from Armenia and percentage of births to unmarried women in the United States with a correlation coefficient (R) of -0.324 and weighted average of 26.1%, a difference of 15.6%.
Births to Unmarried Women Correlation Summary
| Measurement | Immigrants from Argentina | Immigrants from Armenia |
| Minimum | 4.0% | 2.5% |
| Maximum | 100.0% | 70.6% |
| Range | 96.0% | 68.1% |
| Mean | 35.7% | 28.3% |
| Median | 30.9% | 28.3% |
| Interquartile 25% (IQ1) | 21.2% | 16.1% |
| Interquartile 75% (IQ3) | 39.8% | 37.8% |
| Interquartile Range (IQR) | 18.5% | 21.7% |
| Standard Deviation (Sample) | 22.9% | 16.0% |
| Standard Deviation (Population) | 22.7% | 15.8% |
Similar Demographics by Births to Unmarried Women
Demographics Similar to Immigrants from Argentina by Births to Unmarried Women
In terms of births to unmarried women, the demographic groups most similar to Immigrants from Argentina are Korean (30.1%, a difference of 0.050%), Ugandan (30.1%, a difference of 0.12%), Syrian (30.2%, a difference of 0.13%), Croatian (30.2%, a difference of 0.17%), and Vietnamese (30.2%, a difference of 0.24%).
| Demographics | Rating | Rank | Births to Unmarried Women |
| Ethiopians | 91.9 /100 | #115 | Exceptional 29.8% |
| Immigrants | Italy | 91.7 /100 | #116 | Exceptional 29.9% |
| Immigrants | Netherlands | 91.1 /100 | #117 | Exceptional 29.9% |
| Immigrants | Norway | 91.0 /100 | #118 | Exceptional 29.9% |
| Argentineans | 90.5 /100 | #119 | Exceptional 30.0% |
| Ugandans | 89.2 /100 | #120 | Excellent 30.1% |
| Koreans | 88.9 /100 | #121 | Excellent 30.1% |
| Immigrants | Argentina | 88.7 /100 | #122 | Excellent 30.1% |
| Syrians | 88.2 /100 | #123 | Excellent 30.2% |
| Croatians | 88.0 /100 | #124 | Excellent 30.2% |
| Vietnamese | 87.7 /100 | #125 | Excellent 30.2% |
| Europeans | 87.2 /100 | #126 | Excellent 30.2% |
| Chinese | 87.1 /100 | #127 | Excellent 30.2% |
| Icelanders | 86.0 /100 | #128 | Excellent 30.3% |
| Immigrants | Spain | 85.8 /100 | #129 | Excellent 30.3% |
Demographics Similar to Immigrants from Armenia by Births to Unmarried Women
In terms of births to unmarried women, the demographic groups most similar to Immigrants from Armenia are Armenian (26.2%, a difference of 0.58%), Immigrants from Korea (26.3%, a difference of 0.80%), Soviet Union (26.3%, a difference of 0.93%), Immigrants from Uzbekistan (25.8%, a difference of 1.1%), and Burmese (26.4%, a difference of 1.2%).
| Demographics | Rating | Rank | Births to Unmarried Women |
| Immigrants | Israel | 100.0 /100 | #11 | Exceptional 25.1% |
| Indians (Asian) | 100.0 /100 | #12 | Exceptional 25.3% |
| Iranians | 100.0 /100 | #13 | Exceptional 25.3% |
| Immigrants | Lebanon | 100.0 /100 | #14 | Exceptional 25.3% |
| Immigrants | Singapore | 100.0 /100 | #15 | Exceptional 25.6% |
| Immigrants | Belarus | 100.0 /100 | #16 | Exceptional 25.6% |
| Immigrants | Uzbekistan | 100.0 /100 | #17 | Exceptional 25.8% |
| Immigrants | Armenia | 99.9 /100 | #18 | Exceptional 26.1% |
| Armenians | 99.9 /100 | #19 | Exceptional 26.2% |
| Immigrants | Korea | 99.9 /100 | #20 | Exceptional 26.3% |
| Soviet Union | 99.9 /100 | #21 | Exceptional 26.3% |
| Burmese | 99.9 /100 | #22 | Exceptional 26.4% |
| Immigrants | Japan | 99.9 /100 | #23 | Exceptional 26.4% |
| Immigrants | Australia | 99.9 /100 | #24 | Exceptional 26.6% |
| Cambodians | 99.9 /100 | #25 | Exceptional 26.7% |