Albanian vs Immigrants from Armenia Births to Unmarried Women
COMPARE
Albanian
Immigrants from Armenia
Births to Unmarried Women
Births to Unmarried Women Comparison
Albanians
Immigrants from Armenia
28.5%
BIRTHS TO UNMARRIED WOMEN
98.5/ 100
METRIC RATING
73rd/ 347
METRIC RANK
26.1%
BIRTHS TO UNMARRIED WOMEN
99.9/ 100
METRIC RATING
18th/ 347
METRIC RANK
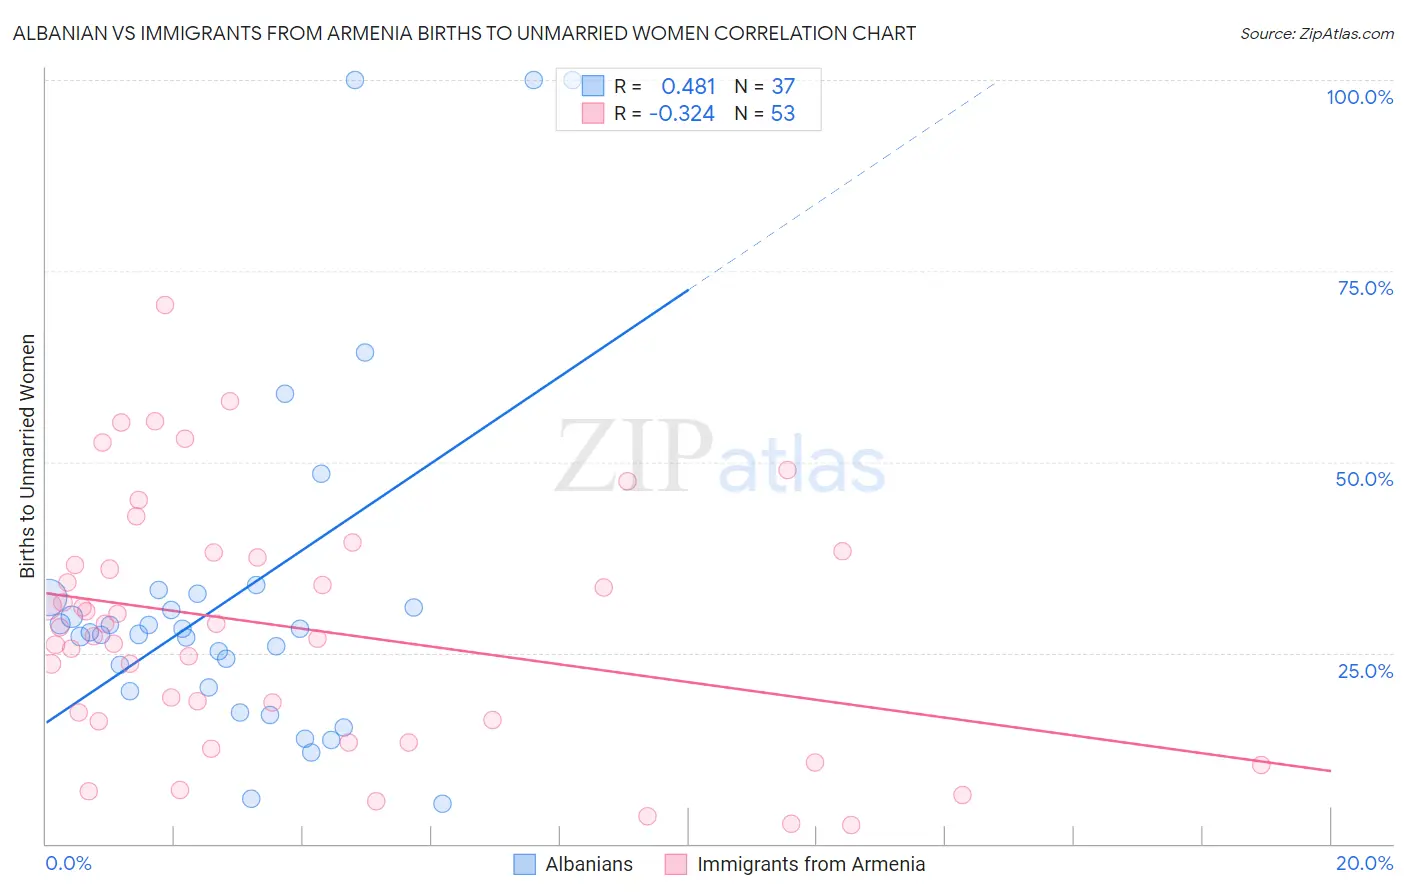
Albanian vs Immigrants from Armenia Births to Unmarried Women Correlation Chart
The statistical analysis conducted on geographies consisting of 182,909,720 people shows a moderate positive correlation between the proportion of Albanians and percentage of births to unmarried women in the United States with a correlation coefficient (R) of 0.481 and weighted average of 28.5%. Similarly, the statistical analysis conducted on geographies consisting of 94,792,248 people shows a mild negative correlation between the proportion of Immigrants from Armenia and percentage of births to unmarried women in the United States with a correlation coefficient (R) of -0.324 and weighted average of 26.1%, a difference of 9.6%.
Births to Unmarried Women Correlation Summary
| Measurement | Albanian | Immigrants from Armenia |
| Minimum | 5.2% | 2.5% |
| Maximum | 100.0% | 70.6% |
| Range | 94.8% | 68.1% |
| Mean | 32.8% | 28.3% |
| Median | 27.7% | 28.3% |
| Interquartile 25% (IQ1) | 20.2% | 16.1% |
| Interquartile 75% (IQ3) | 32.5% | 37.8% |
| Interquartile Range (IQR) | 12.3% | 21.7% |
| Standard Deviation (Sample) | 23.4% | 16.0% |
| Standard Deviation (Population) | 23.1% | 15.8% |
Similar Demographics by Births to Unmarried Women
Demographics Similar to Albanians by Births to Unmarried Women
In terms of births to unmarried women, the demographic groups most similar to Albanians are Immigrants from Bolivia (28.6%, a difference of 0.020%), Immigrants from Sweden (28.5%, a difference of 0.050%), Jordanian (28.5%, a difference of 0.11%), Immigrants from Switzerland (28.6%, a difference of 0.11%), and Israeli (28.6%, a difference of 0.13%).
| Demographics | Rating | Rank | Births to Unmarried Women |
| Immigrants | Egypt | 98.8 /100 | #66 | Exceptional 28.4% |
| Palestinians | 98.7 /100 | #67 | Exceptional 28.4% |
| Immigrants | Europe | 98.7 /100 | #68 | Exceptional 28.4% |
| Bolivians | 98.7 /100 | #69 | Exceptional 28.5% |
| Laotians | 98.6 /100 | #70 | Exceptional 28.5% |
| Jordanians | 98.5 /100 | #71 | Exceptional 28.5% |
| Immigrants | Sweden | 98.5 /100 | #72 | Exceptional 28.5% |
| Albanians | 98.5 /100 | #73 | Exceptional 28.5% |
| Immigrants | Bolivia | 98.5 /100 | #74 | Exceptional 28.6% |
| Immigrants | Switzerland | 98.4 /100 | #75 | Exceptional 28.6% |
| Israelis | 98.4 /100 | #76 | Exceptional 28.6% |
| Immigrants | Northern Europe | 98.3 /100 | #77 | Exceptional 28.6% |
| Zimbabweans | 98.2 /100 | #78 | Exceptional 28.7% |
| Danes | 98.2 /100 | #79 | Exceptional 28.7% |
| Immigrants | Afghanistan | 98.1 /100 | #80 | Exceptional 28.7% |
Demographics Similar to Immigrants from Armenia by Births to Unmarried Women
In terms of births to unmarried women, the demographic groups most similar to Immigrants from Armenia are Armenian (26.2%, a difference of 0.58%), Immigrants from Korea (26.3%, a difference of 0.80%), Soviet Union (26.3%, a difference of 0.93%), Immigrants from Uzbekistan (25.8%, a difference of 1.1%), and Burmese (26.4%, a difference of 1.2%).
| Demographics | Rating | Rank | Births to Unmarried Women |
| Immigrants | Israel | 100.0 /100 | #11 | Exceptional 25.1% |
| Indians (Asian) | 100.0 /100 | #12 | Exceptional 25.3% |
| Iranians | 100.0 /100 | #13 | Exceptional 25.3% |
| Immigrants | Lebanon | 100.0 /100 | #14 | Exceptional 25.3% |
| Immigrants | Singapore | 100.0 /100 | #15 | Exceptional 25.6% |
| Immigrants | Belarus | 100.0 /100 | #16 | Exceptional 25.6% |
| Immigrants | Uzbekistan | 100.0 /100 | #17 | Exceptional 25.8% |
| Immigrants | Armenia | 99.9 /100 | #18 | Exceptional 26.1% |
| Armenians | 99.9 /100 | #19 | Exceptional 26.2% |
| Immigrants | Korea | 99.9 /100 | #20 | Exceptional 26.3% |
| Soviet Union | 99.9 /100 | #21 | Exceptional 26.3% |
| Burmese | 99.9 /100 | #22 | Exceptional 26.4% |
| Immigrants | Japan | 99.9 /100 | #23 | Exceptional 26.4% |
| Immigrants | Australia | 99.9 /100 | #24 | Exceptional 26.6% |
| Cambodians | 99.9 /100 | #25 | Exceptional 26.7% |