Native Hawaiian vs Immigrants from Armenia Births to Unmarried Women

COMPARE

Native Hawaiian
Race
Ancestry
AfghanAfricanAlaska NativeAlaskan AthabascanAlbanianAleutAlsatianAmericanApacheArabArapahoArgentineanArmenianAssyrian/Chaldean/SyriacAustralianAustrianBahamianBangladeshiBarbadianBasqueBelgianBelizeanBermudanBhutaneseBlackfeetBolivianBrazilianBritishBritish West IndianBulgarianBurmeseCajunCambodianCanadianCape VerdeanCarpatho RusynCelticCentral AmericanCentral American IndianCherokeeCheyenneChickasawChileanChineseChippewaChoctawColombianColvilleComancheCosta RicanCreeCreekCroatianCrowCubanCypriotCzechCzechoslovakianDanishDelawareDominicanDutchDutch West IndianEastern EuropeanEcuadorianEgyptianEnglishEstonianEthiopianEuropeanFijianFilipinoFinnishFrenchFrench American IndianFrench CanadianGermanGerman RussianGhanaianGreekGuamanian/ChamorroGuatemalanGuyaneseHaitianHmongHonduranHopiHoumaHungarianIcelanderIndian (Asian)IndonesianInupiatIranianIraqiIrishIroquoisIsraeliItalianJamaicanJapaneseJordanianKenyanKiowaKoreanLaotianLatvianLebaneseLiberianLithuanianLumbeeLuxembourgerMacedonianMalaysianMalteseMarshalleseMenomineeMexicanMexican American IndianMongolianMoroccanNative HawaiianNavajoNepaleseNew ZealanderNicaraguanNigerianNorthern EuropeanNorwegianOkinawanOsageOttawaPaiutePakistaniPalestinianPanamanianParaguayanPennsylvania GermanPeruvianPimaPolishPortuguesePotawatomiPuebloPuerto RicanPuget Sound SalishRomanianRussianSalvadoranSamoanScandinavianScotch-IrishScottishSeminoleSenegaleseSerbianShoshoneSierra LeoneanSiouxSlavicSlovakSloveneSomaliSouth AfricanSouth AmericanSouth American IndianSoviet UnionSpaniardSpanishSpanish AmericanSpanish American IndianSri LankanSubsaharan AfricanSudaneseSwedishSwissSyrianTaiwaneseThaiTlingit-HaidaTohono O'OdhamTonganTrinidadian and TobagonianTsimshianTurkishU.S. Virgin IslanderUgandanUkrainianUruguayanUteVenezuelanVietnameseWelshWest IndianYakamaYaquiYugoslavianYumanYup'ikZimbabwean
Immigration
NonimmigrantsImmigrantsAfghanistanAfricaAlbaniaArgentinaAsiaAustraliaAustriaBahamasBangladeshBarbadosBelarusBelgiumBelizeBoliviaBosnia and HerzegovinaBrazilBulgariaBurma/MyanmarCabo VerdeCambodiaCameroonCanadaCaribbeanCentral AmericaChileChinaColombiaCongoCosta RicaCroatiaCubaCzechoslovakiaDenmarkDominicaDominican RepublicEastern AfricaEastern AsiaEastern EuropeEcuadorEgyptEl SalvadorEnglandEritreaEthiopiaEuropeFijiFranceGermanyGhanaGreeceGrenadaGuatemalaGuyanaHaitiHondurasHong KongHungaryIndiaIndonesiaIranIraqIrelandIsraelItalyJamaicaJapanJordanKazakhstanKenyaKoreaKuwaitLaosLatin AmericaLatviaLebanonLiberiaLithuaniaMalaysiaMexicoMicronesiaMiddle AfricaMoldovaMoroccoNepalNetherlandsNicaraguaNigeriaNorth AmericaNorth MacedoniaNorthern AfricaNorthern EuropeNorwayOceaniaPakistanPanamaPeruPhilippinesPolandPortugalRomaniaRussiaSaudi ArabiaScotlandSenegalSerbiaSierra LeoneSingaporeSomaliaSouth AfricaSouth AmericaSouth Central AsiaSouth Eastern AsiaSouthern EuropeSpainSri LankaSt. Vincent and the GrenadinesSudanSwedenSwitzerlandSyriaTaiwanThailandTrinidad and TobagoTurkeyUgandaUkraineUruguayUzbekistanVenezuelaVietnamWest IndiesWestern AfricaWestern AsiaWestern EuropeYemenZaireZimbabweAzores
Immigrants from Armenia
Race
Ancestry
AfghanAfricanAlaska NativeAlaskan AthabascanAlbanianAleutAlsatianAmericanApacheArabArapahoArgentineanArmenianAssyrian/Chaldean/SyriacAustralianAustrianBahamianBangladeshiBarbadianBasqueBelgianBelizeanBermudanBhutaneseBlackfeetBolivianBrazilianBritishBritish West IndianBulgarianBurmeseCajunCambodianCanadianCape VerdeanCarpatho RusynCelticCentral AmericanCentral American IndianCherokeeCheyenneChickasawChileanChineseChippewaChoctawColombianColvilleComancheCosta RicanCreeCreekCroatianCrowCubanCypriotCzechCzechoslovakianDanishDelawareDominicanDutchDutch West IndianEastern EuropeanEcuadorianEgyptianEnglishEstonianEthiopianEuropeanFijianFilipinoFinnishFrenchFrench American IndianFrench CanadianGermanGerman RussianGhanaianGreekGuamanian/ChamorroGuatemalanGuyaneseHaitianHmongHonduranHopiHoumaHungarianIcelanderIndian (Asian)IndonesianInupiatIranianIraqiIrishIroquoisIsraeliItalianJamaicanJapaneseJordanianKenyanKiowaKoreanLaotianLatvianLebaneseLiberianLithuanianLumbeeLuxembourgerMacedonianMalaysianMalteseMarshalleseMenomineeMexicanMexican American IndianMongolianMoroccanNavajoNepaleseNew ZealanderNicaraguanNigerianNorthern EuropeanNorwegianOkinawanOsageOttawaPaiutePakistaniPalestinianPanamanianParaguayanPennsylvania GermanPeruvianPimaPolishPortuguesePotawatomiPuebloPuerto RicanPuget Sound SalishRomanianRussianSalvadoranSamoanScandinavianScotch-IrishScottishSeminoleSenegaleseSerbianShoshoneSierra LeoneanSiouxSlavicSlovakSloveneSomaliSouth AfricanSouth AmericanSouth American IndianSoviet UnionSpaniardSpanishSpanish AmericanSpanish American IndianSri LankanSubsaharan AfricanSudaneseSwedishSwissSyrianTaiwaneseThaiTlingit-HaidaTohono O'OdhamTonganTrinidadian and TobagonianTsimshianTurkishU.S. Virgin IslanderUgandanUkrainianUruguayanUteVenezuelanVietnameseWelshWest IndianYakamaYaquiYugoslavianYumanYup'ikZimbabwean
Immigration
NonimmigrantsImmigrantsAfghanistanAfricaAlbaniaArgentinaArmeniaAsiaAustraliaAustriaBahamasBangladeshBarbadosBelarusBelgiumBelizeBoliviaBosnia and HerzegovinaBrazilBulgariaBurma/MyanmarCabo VerdeCambodiaCameroonCanadaCaribbeanCentral AmericaChileChinaColombiaCongoCosta RicaCroatiaCubaCzechoslovakiaDenmarkDominicaDominican RepublicEastern AfricaEastern AsiaEastern EuropeEcuadorEgyptEl SalvadorEnglandEritreaEthiopiaEuropeFijiFranceGermanyGhanaGreeceGrenadaGuatemalaGuyanaHaitiHondurasHong KongHungaryIndiaIndonesiaIranIraqIrelandIsraelItalyJamaicaJapanJordanKazakhstanKenyaKoreaKuwaitLaosLatin AmericaLatviaLebanonLiberiaLithuaniaMalaysiaMexicoMicronesiaMiddle AfricaMoldovaMoroccoNepalNetherlandsNicaraguaNigeriaNorth AmericaNorth MacedoniaNorthern AfricaNorthern EuropeNorwayOceaniaPakistanPanamaPeruPhilippinesPolandPortugalRomaniaRussiaSaudi ArabiaScotlandSenegalSerbiaSierra LeoneSingaporeSomaliaSouth AfricaSouth AmericaSouth Central AsiaSouth Eastern AsiaSouthern EuropeSpainSri LankaSt. Vincent and the GrenadinesSudanSwedenSwitzerlandSyriaTaiwanThailandTrinidad and TobagoTurkeyUgandaUkraineUruguayUzbekistanVenezuelaVietnamWest IndiesWestern AfricaWestern AsiaWestern EuropeYemenZaireZimbabweAzores
Births to Unmarried Women
Income
Poverty
Unemployment
Labor Participation
Family Structure
Vehicle Availability
Education Level
Disability

Births to Unmarried Women Comparison

Native Hawaiians

Immigrants from Armenia

Tragic
Exceptional
34.3%
BIRTHS TO UNMARRIED WOMEN
2.9/ 100
METRIC RATING
231st/ 347
METRIC RANK
26.1%
BIRTHS TO UNMARRIED WOMEN
99.9/ 100
METRIC RATING
18th/ 347
METRIC RANK

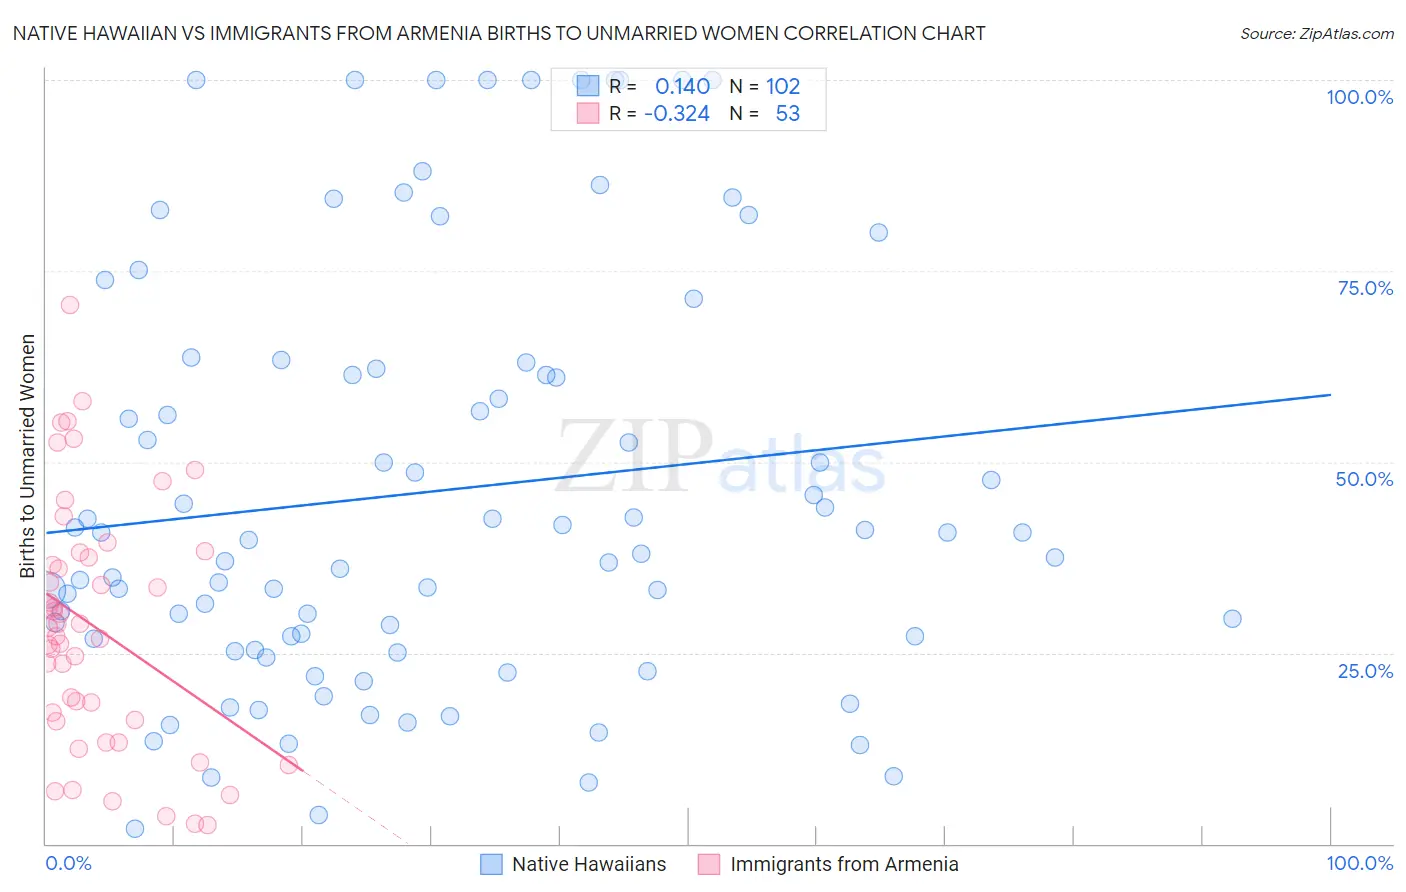
Native Hawaiian vs Immigrants from Armenia Births to Unmarried Women Correlation Chart

The statistical analysis conducted on geographies consisting of 315,286,073 people shows a poor positive correlation between the proportion of Native Hawaiians and percentage of births to unmarried women in the United States with a correlation coefficient (R) of 0.140 and weighted average of 34.3%. Similarly, the statistical analysis conducted on geographies consisting of 94,792,248 people shows a mild negative correlation between the proportion of Immigrants from Armenia and percentage of births to unmarried women in the United States with a correlation coefficient (R) of -0.324 and weighted average of 26.1%, a difference of 31.6%.
Native Hawaiian vs Immigrants from Armenia Births to Unmarried Women

Births to Unmarried Women Correlation Summary

MeasurementNative HawaiianImmigrants from Armenia
Minimum1.9%2.5%
Maximum100.0%70.6%
Range98.1%68.1%
Mean46.1%28.3%
Median40.2%28.3%
Interquartile 25% (IQ1)26.8%16.1%
Interquartile 75% (IQ3)62.2%37.8%
Interquartile Range (IQR)35.4%21.7%
Standard Deviation (Sample)27.3%16.0%
Standard Deviation (Population)27.1%15.8%

Similar Demographics by Births to Unmarried Women

Demographics Similar to Native Hawaiians by Births to Unmarried Women

In terms of births to unmarried women, the demographic groups most similar to Native Hawaiians are Ghanaian (34.3%, a difference of 0.14%), Immigrants from Sierra Leone (34.2%, a difference of 0.17%), Panamanian (34.2%, a difference of 0.28%), French Canadian (34.4%, a difference of 0.30%), and Immigrants from Panama (34.2%, a difference of 0.31%).
DemographicsRating | RankBirths to Unmarried Women
Immigrants | Laos
4.3
/100
|
#224
Tragic
34.0%
Spanish
4.0
/100
|
#225
Tragic
34.1%
Delaware
3.3
/100
|
#226
Tragic
34.2%
Immigrants | Panama
3.3
/100
|
#227
Tragic
34.2%
Panamanians
3.3
/100
|
#228
Tragic
34.2%
Immigrants | Sierra Leone
3.1
/100
|
#229
Tragic
34.2%
Ghanaians
3.1
/100
|
#230
Tragic
34.3%
Native Hawaiians
2.9
/100
|
#231
Tragic
34.3%
French Canadians
2.5
/100
|
#232
Tragic
34.4%
Bangladeshis
2.5
/100
|
#233
Tragic
34.4%
Immigrants | Zaire
2.3
/100
|
#234
Tragic
34.5%
Immigrants | Ghana
2.2
/100
|
#235
Tragic
34.5%
Immigrants | Cameroon
1.6
/100
|
#236
Tragic
34.7%
Marshallese
1.6
/100
|
#237
Tragic
34.8%
Immigrants | Cambodia
1.6
/100
|
#238
Tragic
34.8%

Demographics Similar to Immigrants from Armenia by Births to Unmarried Women

In terms of births to unmarried women, the demographic groups most similar to Immigrants from Armenia are Armenian (26.2%, a difference of 0.58%), Immigrants from Korea (26.3%, a difference of 0.80%), Soviet Union (26.3%, a difference of 0.93%), Immigrants from Uzbekistan (25.8%, a difference of 1.1%), and Burmese (26.4%, a difference of 1.2%).
DemographicsRating | RankBirths to Unmarried Women
Immigrants | Israel
100.0
/100
|
#11
Exceptional
25.1%
Indians (Asian)
100.0
/100
|
#12
Exceptional
25.3%
Iranians
100.0
/100
|
#13
Exceptional
25.3%
Immigrants | Lebanon
100.0
/100
|
#14
Exceptional
25.3%
Immigrants | Singapore
100.0
/100
|
#15
Exceptional
25.6%
Immigrants | Belarus
100.0
/100
|
#16
Exceptional
25.6%
Immigrants | Uzbekistan
100.0
/100
|
#17
Exceptional
25.8%
Immigrants | Armenia
99.9
/100
|
#18
Exceptional
26.1%
Armenians
99.9
/100
|
#19
Exceptional
26.2%
Immigrants | Korea
99.9
/100
|
#20
Exceptional
26.3%
Soviet Union
99.9
/100
|
#21
Exceptional
26.3%
Burmese
99.9
/100
|
#22
Exceptional
26.4%
Immigrants | Japan
99.9
/100
|
#23
Exceptional
26.4%
Immigrants | Australia
99.9
/100
|
#24
Exceptional
26.6%
Cambodians
99.9
/100
|
#25
Exceptional
26.7%