West Indian vs Immigrants from Armenia Unemployment Among Ages 20 to 24 years
COMPARE
West Indian
Immigrants from Armenia
Unemployment Among Ages 20 to 24 years
Unemployment Among Ages 20 to 24 years Comparison
West Indians
Immigrants from Armenia
12.8%
UNEMPLOYMENT AMONG AGES 20 TO 24 YEARS
0.0/ 100
METRIC RATING
315th/ 347
METRIC RANK
12.0%
UNEMPLOYMENT AMONG AGES 20 TO 24 YEARS
0.0/ 100
METRIC RATING
295th/ 347
METRIC RANK
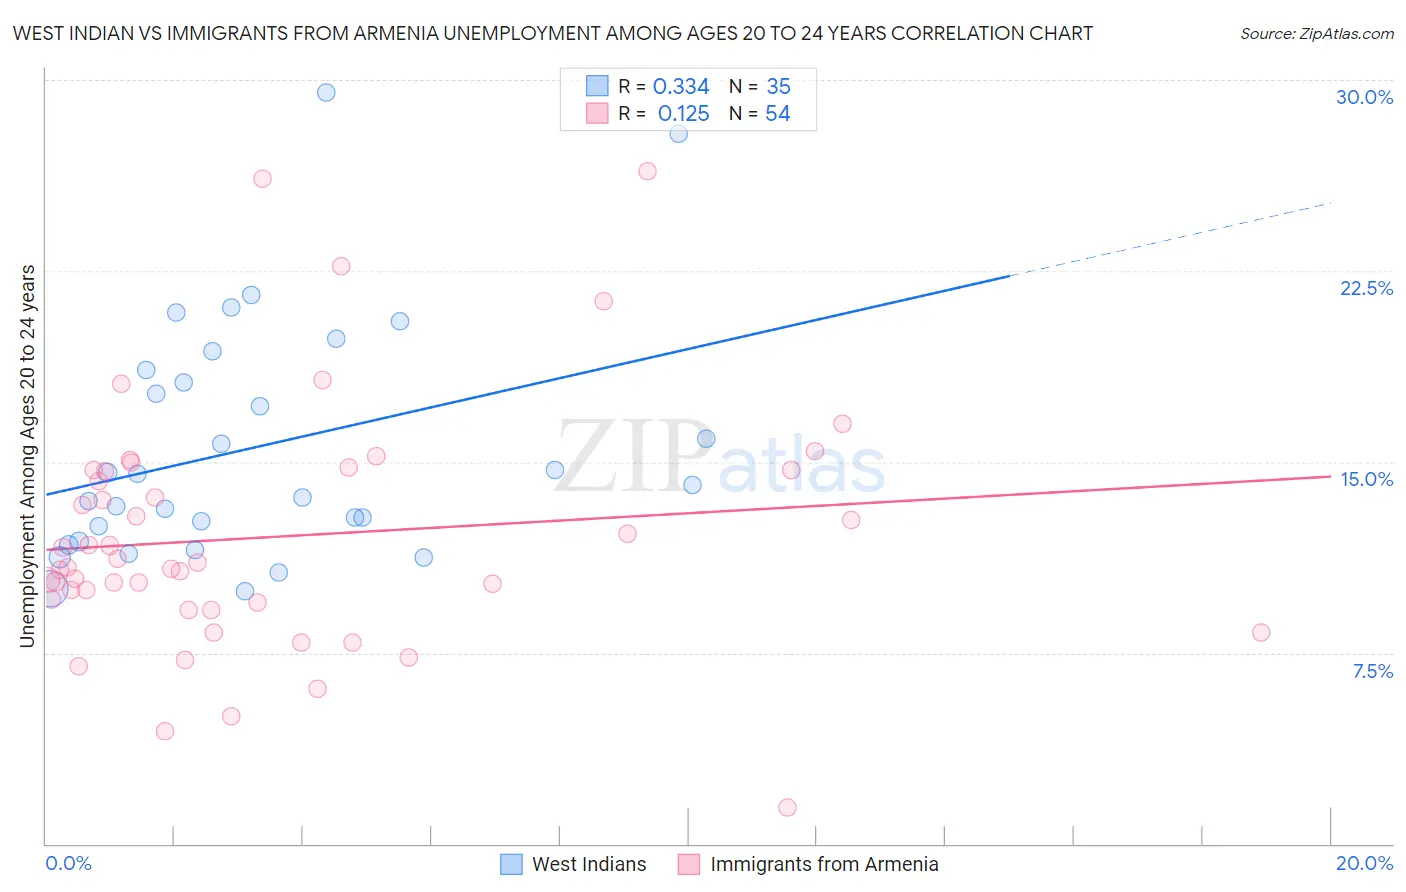
West Indian vs Immigrants from Armenia Unemployment Among Ages 20 to 24 years Correlation Chart
The statistical analysis conducted on geographies consisting of 250,382,196 people shows a mild positive correlation between the proportion of West Indians and unemployment rate among population between the ages 20 and 24 in the United States with a correlation coefficient (R) of 0.334 and weighted average of 12.8%. Similarly, the statistical analysis conducted on geographies consisting of 97,169,486 people shows a poor positive correlation between the proportion of Immigrants from Armenia and unemployment rate among population between the ages 20 and 24 in the United States with a correlation coefficient (R) of 0.125 and weighted average of 12.0%, a difference of 6.6%.
Unemployment Among Ages 20 to 24 years Correlation Summary
| Measurement | West Indian | Immigrants from Armenia |
| Minimum | 9.9% | 1.4% |
| Maximum | 29.5% | 26.4% |
| Range | 19.6% | 25.0% |
| Mean | 15.6% | 12.1% |
| Median | 14.1% | 11.0% |
| Interquartile 25% (IQ1) | 11.9% | 9.5% |
| Interquartile 75% (IQ3) | 18.6% | 14.7% |
| Interquartile Range (IQR) | 6.7% | 5.2% |
| Standard Deviation (Sample) | 4.7% | 4.8% |
| Standard Deviation (Population) | 4.7% | 4.8% |
Demographics Similar to West Indians and Immigrants from Armenia by Unemployment Among Ages 20 to 24 years
In terms of unemployment among ages 20 to 24 years, the demographic groups most similar to West Indians are Black/African American (12.7%, a difference of 0.21%), Shoshone (12.7%, a difference of 0.40%), Houma (12.6%, a difference of 0.94%), Vietnamese (12.6%, a difference of 1.1%), and Jamaican (12.6%, a difference of 1.5%). Similarly, the demographic groups most similar to Immigrants from Armenia are Cajun (12.0%, a difference of 0.030%), Blackfeet (12.0%, a difference of 0.040%), Lumbee (12.0%, a difference of 0.50%), Apache (12.0%, a difference of 0.53%), and Spanish American Indian (12.1%, a difference of 0.68%).
| Demographics | Rating | Rank | Unemployment Among Ages 20 to 24 years |
| Immigrants | Armenia | 0.0 /100 | #295 | Tragic 12.0% |
| Cajuns | 0.0 /100 | #296 | Tragic 12.0% |
| Blackfeet | 0.0 /100 | #297 | Tragic 12.0% |
| Lumbee | 0.0 /100 | #298 | Tragic 12.0% |
| Apache | 0.0 /100 | #299 | Tragic 12.0% |
| Spanish American Indians | 0.0 /100 | #300 | Tragic 12.1% |
| Immigrants | Sierra Leone | 0.0 /100 | #301 | Tragic 12.1% |
| Immigrants | Cabo Verde | 0.0 /100 | #302 | Tragic 12.2% |
| Haitians | 0.0 /100 | #303 | Tragic 12.2% |
| Immigrants | West Indies | 0.0 /100 | #304 | Tragic 12.3% |
| Chippewa | 0.0 /100 | #305 | Tragic 12.3% |
| Immigrants | Haiti | 0.0 /100 | #306 | Tragic 12.4% |
| Bermudans | 0.0 /100 | #307 | Tragic 12.5% |
| Tohono O'odham | 0.0 /100 | #308 | Tragic 12.5% |
| Immigrants | Bangladesh | 0.0 /100 | #309 | Tragic 12.6% |
| Jamaicans | 0.0 /100 | #310 | Tragic 12.6% |
| Vietnamese | 0.0 /100 | #311 | Tragic 12.6% |
| Houma | 0.0 /100 | #312 | Tragic 12.6% |
| Shoshone | 0.0 /100 | #313 | Tragic 12.7% |
| Blacks/African Americans | 0.0 /100 | #314 | Tragic 12.7% |
| West Indians | 0.0 /100 | #315 | Tragic 12.8% |