West Indian vs Immigrants from Senegal Births to Unmarried Women
COMPARE
West Indian
Immigrants from Senegal
Births to Unmarried Women
Births to Unmarried Women Comparison
West Indians
Immigrants from Senegal
37.3%
BIRTHS TO UNMARRIED WOMEN
0.1/ 100
METRIC RATING
279th/ 347
METRIC RANK
36.7%
BIRTHS TO UNMARRIED WOMEN
0.1/ 100
METRIC RATING
266th/ 347
METRIC RANK
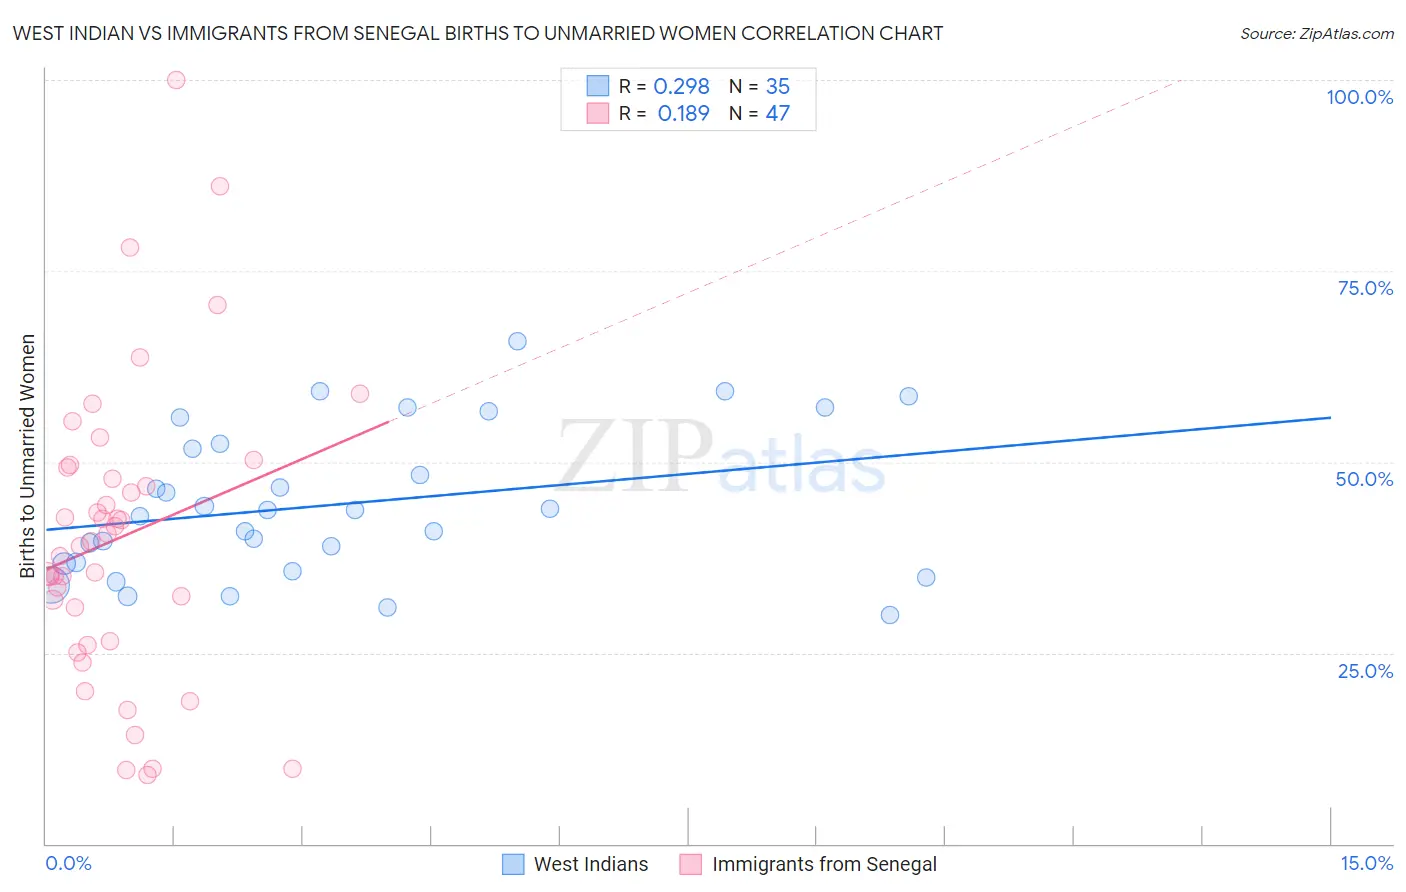
West Indian vs Immigrants from Senegal Births to Unmarried Women Correlation Chart
The statistical analysis conducted on geographies consisting of 244,812,530 people shows a weak positive correlation between the proportion of West Indians and percentage of births to unmarried women in the United States with a correlation coefficient (R) of 0.298 and weighted average of 37.3%. Similarly, the statistical analysis conducted on geographies consisting of 88,702,422 people shows a poor positive correlation between the proportion of Immigrants from Senegal and percentage of births to unmarried women in the United States with a correlation coefficient (R) of 0.189 and weighted average of 36.7%, a difference of 1.6%.
Births to Unmarried Women Correlation Summary
| Measurement | West Indian | Immigrants from Senegal |
| Minimum | 30.0% | 9.0% |
| Maximum | 65.8% | 100.0% |
| Range | 35.8% | 91.0% |
| Mean | 44.5% | 40.1% |
| Median | 43.7% | 39.5% |
| Interquartile 25% (IQ1) | 36.7% | 26.5% |
| Interquartile 75% (IQ3) | 52.4% | 49.2% |
| Interquartile Range (IQR) | 15.7% | 22.8% |
| Standard Deviation (Sample) | 9.6% | 19.3% |
| Standard Deviation (Population) | 9.5% | 19.1% |
Demographics Similar to West Indians and Immigrants from Senegal by Births to Unmarried Women
In terms of births to unmarried women, the demographic groups most similar to West Indians are Immigrants from St. Vincent and the Grenadines (37.3%, a difference of 0.12%), Immigrants from Belize (37.3%, a difference of 0.13%), Liberian (37.4%, a difference of 0.30%), Immigrants from Latin America (37.1%, a difference of 0.33%), and Guatemalan (37.1%, a difference of 0.42%). Similarly, the demographic groups most similar to Immigrants from Senegal are Cherokee (36.7%, a difference of 0.050%), Central American (36.7%, a difference of 0.070%), Comanche (36.7%, a difference of 0.080%), Subsaharan African (36.7%, a difference of 0.10%), and Senegalese (36.8%, a difference of 0.20%).
| Demographics | Rating | Rank | Births to Unmarried Women |
| French American Indians | 0.1 /100 | #262 | Tragic 36.6% |
| Nicaraguans | 0.1 /100 | #263 | Tragic 36.6% |
| Sub-Saharan Africans | 0.1 /100 | #264 | Tragic 36.7% |
| Cherokee | 0.1 /100 | #265 | Tragic 36.7% |
| Immigrants | Senegal | 0.1 /100 | #266 | Tragic 36.7% |
| Central Americans | 0.1 /100 | #267 | Tragic 36.7% |
| Comanche | 0.1 /100 | #268 | Tragic 36.7% |
| Senegalese | 0.1 /100 | #269 | Tragic 36.8% |
| Immigrants | Congo | 0.1 /100 | #270 | Tragic 36.8% |
| Immigrants | Barbados | 0.1 /100 | #271 | Tragic 36.8% |
| Choctaw | 0.1 /100 | #272 | Tragic 36.9% |
| Mexicans | 0.1 /100 | #273 | Tragic 36.9% |
| Cree | 0.1 /100 | #274 | Tragic 37.0% |
| Barbadians | 0.1 /100 | #275 | Tragic 37.0% |
| Belizeans | 0.1 /100 | #276 | Tragic 37.0% |
| Guatemalans | 0.1 /100 | #277 | Tragic 37.1% |
| Immigrants | Latin America | 0.1 /100 | #278 | Tragic 37.1% |
| West Indians | 0.1 /100 | #279 | Tragic 37.3% |
| Immigrants | St. Vincent and the Grenadines | 0.1 /100 | #280 | Tragic 37.3% |
| Immigrants | Belize | 0.1 /100 | #281 | Tragic 37.3% |
| Liberians | 0.0 /100 | #282 | Tragic 37.4% |