Ute vs Dominican Single Father Households
COMPARE
Ute
Dominican
Single Father Households
Single Father Households Comparison
Ute
Dominicans
3.0%
SINGLE FATHER HOUSEHOLDS
0.0/ 100
METRIC RATING
319th/ 347
METRIC RANK
2.5%
SINGLE FATHER HOUSEHOLDS
0.8/ 100
METRIC RATING
263rd/ 347
METRIC RANK
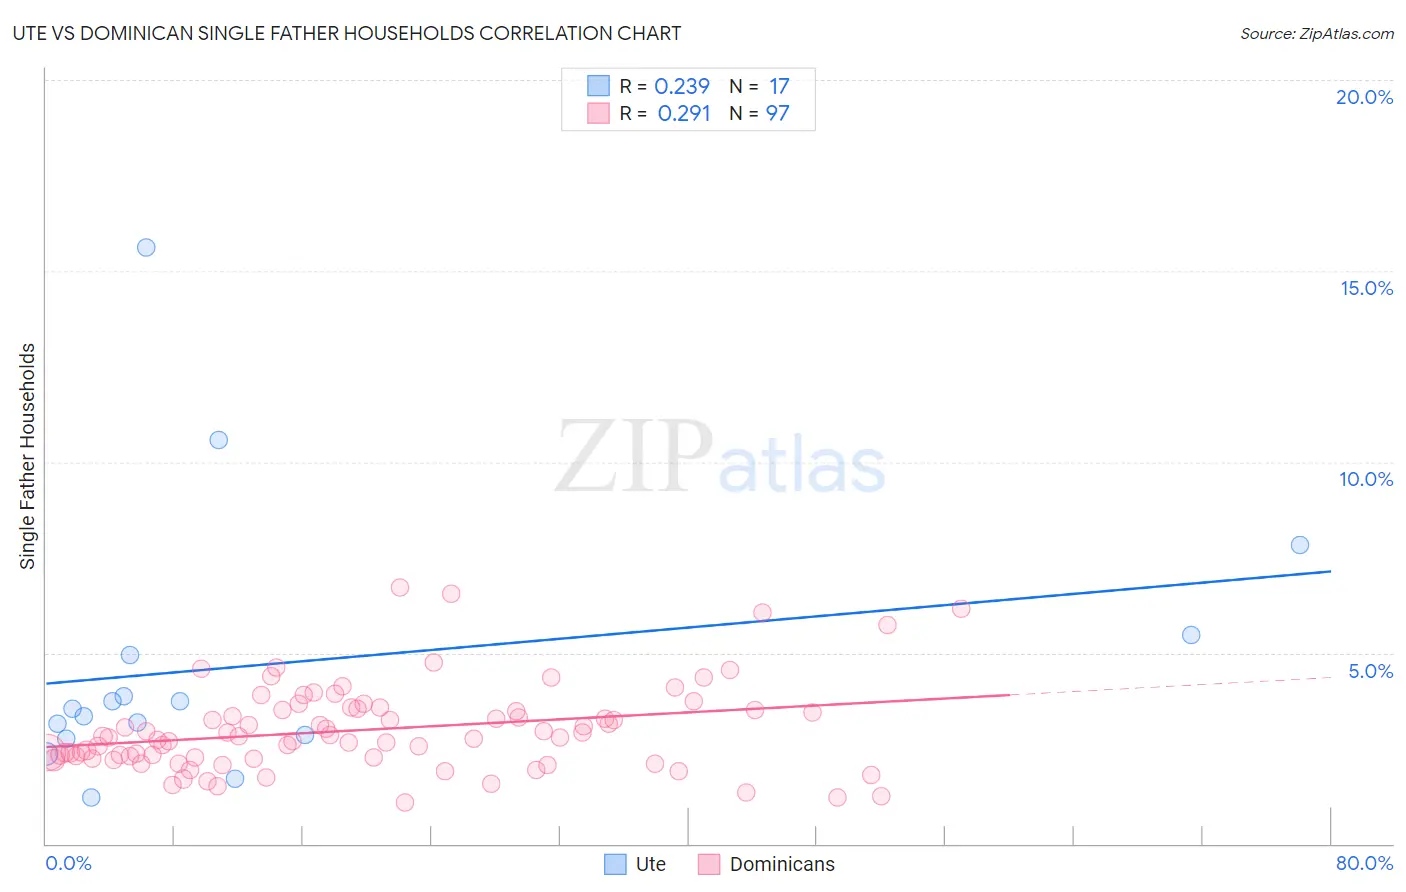
Ute vs Dominican Single Father Households Correlation Chart
The statistical analysis conducted on geographies consisting of 55,604,261 people shows a weak positive correlation between the proportion of Ute and percentage of single father households in the United States with a correlation coefficient (R) of 0.239 and weighted average of 3.0%. Similarly, the statistical analysis conducted on geographies consisting of 351,968,082 people shows a weak positive correlation between the proportion of Dominicans and percentage of single father households in the United States with a correlation coefficient (R) of 0.291 and weighted average of 2.5%, a difference of 16.3%.
Single Father Households Correlation Summary
| Measurement | Ute | Dominican |
| Minimum | 1.2% | 1.1% |
| Maximum | 15.6% | 6.7% |
| Range | 14.4% | 5.6% |
| Mean | 4.7% | 3.0% |
| Median | 3.5% | 2.8% |
| Interquartile 25% (IQ1) | 2.8% | 2.3% |
| Interquartile 75% (IQ3) | 5.2% | 3.5% |
| Interquartile Range (IQR) | 2.4% | 1.3% |
| Standard Deviation (Sample) | 3.6% | 1.1% |
| Standard Deviation (Population) | 3.5% | 1.1% |
Similar Demographics by Single Father Households
Demographics Similar to Ute by Single Father Households
In terms of single father households, the demographic groups most similar to Ute are Guatemalan (3.0%, a difference of 0.080%), Mexican (3.0%, a difference of 0.47%), Cape Verdean (2.9%, a difference of 0.53%), Immigrants from El Salvador (2.9%, a difference of 0.54%), and Immigrants from Guatemala (3.0%, a difference of 1.0%).
| Demographics | Rating | Rank | Single Father Households |
| Tsimshian | 0.0 /100 | #312 | Tragic 2.9% |
| Arapaho | 0.0 /100 | #313 | Tragic 2.9% |
| Salvadorans | 0.0 /100 | #314 | Tragic 2.9% |
| Cheyenne | 0.0 /100 | #315 | Tragic 2.9% |
| Houma | 0.0 /100 | #316 | Tragic 2.9% |
| Immigrants | El Salvador | 0.0 /100 | #317 | Tragic 2.9% |
| Cape Verdeans | 0.0 /100 | #318 | Tragic 2.9% |
| Ute | 0.0 /100 | #319 | Tragic 3.0% |
| Guatemalans | 0.0 /100 | #320 | Tragic 3.0% |
| Mexicans | 0.0 /100 | #321 | Tragic 3.0% |
| Immigrants | Guatemala | 0.0 /100 | #322 | Tragic 3.0% |
| Immigrants | Central America | 0.0 /100 | #323 | Tragic 3.0% |
| Fijians | 0.0 /100 | #324 | Tragic 3.0% |
| Immigrants | Mexico | 0.0 /100 | #325 | Tragic 3.0% |
| Aleuts | 0.0 /100 | #326 | Tragic 3.0% |
Demographics Similar to Dominicans by Single Father Households
In terms of single father households, the demographic groups most similar to Dominicans are Immigrants from Liberia (2.5%, a difference of 0.13%), Immigrants from Belize (2.5%, a difference of 0.28%), Immigrants from Caribbean (2.5%, a difference of 0.44%), Comanche (2.5%, a difference of 0.53%), and Spanish (2.5%, a difference of 0.68%).
| Demographics | Rating | Rank | Single Father Households |
| Potawatomi | 1.4 /100 | #256 | Tragic 2.5% |
| Immigrants | Congo | 1.2 /100 | #257 | Tragic 2.5% |
| Spanish | 1.1 /100 | #258 | Tragic 2.5% |
| Comanche | 1.0 /100 | #259 | Tragic 2.5% |
| Immigrants | Caribbean | 1.0 /100 | #260 | Tragic 2.5% |
| Immigrants | Belize | 0.9 /100 | #261 | Tragic 2.5% |
| Immigrants | Liberia | 0.8 /100 | #262 | Tragic 2.5% |
| Dominicans | 0.8 /100 | #263 | Tragic 2.5% |
| Indonesians | 0.5 /100 | #264 | Tragic 2.6% |
| Immigrants | Micronesia | 0.5 /100 | #265 | Tragic 2.6% |
| French American Indians | 0.5 /100 | #266 | Tragic 2.6% |
| Guamanians/Chamorros | 0.4 /100 | #267 | Tragic 2.6% |
| Haitians | 0.4 /100 | #268 | Tragic 2.6% |
| Cubans | 0.3 /100 | #269 | Tragic 2.6% |
| Seminole | 0.3 /100 | #270 | Tragic 2.6% |