Ute vs Immigrants from Scotland Single Father Households
COMPARE
Ute
Immigrants from Scotland
Single Father Households
Single Father Households Comparison
Ute
Immigrants from Scotland
3.0%
SINGLE FATHER HOUSEHOLDS
0.0/ 100
METRIC RATING
319th/ 347
METRIC RANK
2.1%
SINGLE FATHER HOUSEHOLDS
99.8/ 100
METRIC RATING
76th/ 347
METRIC RANK
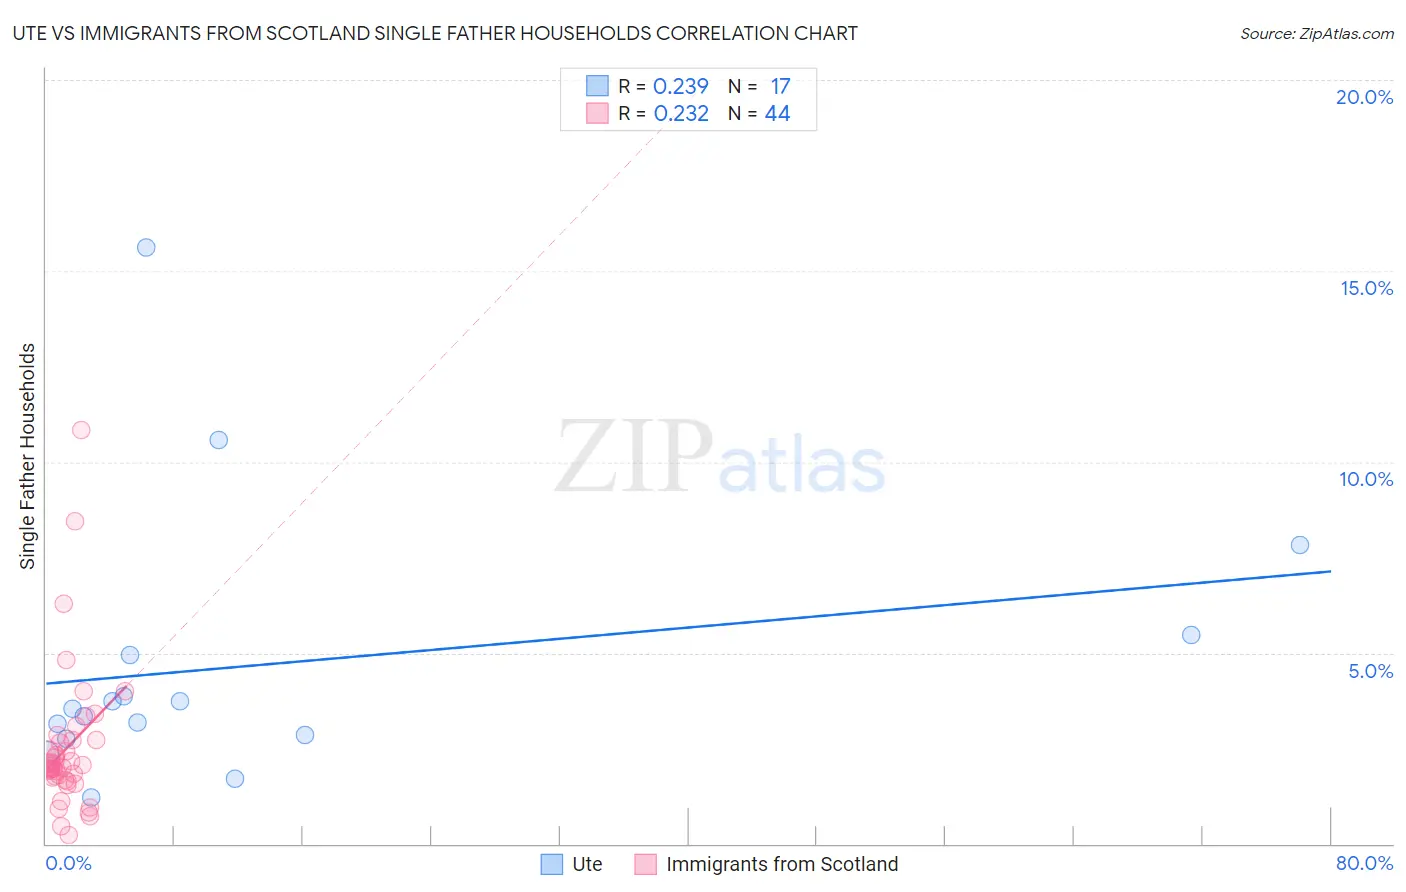
Ute vs Immigrants from Scotland Single Father Households Correlation Chart
The statistical analysis conducted on geographies consisting of 55,604,261 people shows a weak positive correlation between the proportion of Ute and percentage of single father households in the United States with a correlation coefficient (R) of 0.239 and weighted average of 3.0%. Similarly, the statistical analysis conducted on geographies consisting of 195,198,580 people shows a weak positive correlation between the proportion of Immigrants from Scotland and percentage of single father households in the United States with a correlation coefficient (R) of 0.232 and weighted average of 2.1%, a difference of 42.6%.
Single Father Households Correlation Summary
| Measurement | Ute | Immigrants from Scotland |
| Minimum | 1.2% | 0.23% |
| Maximum | 15.6% | 10.8% |
| Range | 14.4% | 10.6% |
| Mean | 4.7% | 2.5% |
| Median | 3.5% | 2.0% |
| Interquartile 25% (IQ1) | 2.8% | 1.7% |
| Interquartile 75% (IQ3) | 5.2% | 2.7% |
| Interquartile Range (IQR) | 2.4% | 1.0% |
| Standard Deviation (Sample) | 3.6% | 1.9% |
| Standard Deviation (Population) | 3.5% | 1.9% |
Similar Demographics by Single Father Households
Demographics Similar to Ute by Single Father Households
In terms of single father households, the demographic groups most similar to Ute are Guatemalan (3.0%, a difference of 0.080%), Mexican (3.0%, a difference of 0.47%), Cape Verdean (2.9%, a difference of 0.53%), Immigrants from El Salvador (2.9%, a difference of 0.54%), and Immigrants from Guatemala (3.0%, a difference of 1.0%).
| Demographics | Rating | Rank | Single Father Households |
| Tsimshian | 0.0 /100 | #312 | Tragic 2.9% |
| Arapaho | 0.0 /100 | #313 | Tragic 2.9% |
| Salvadorans | 0.0 /100 | #314 | Tragic 2.9% |
| Cheyenne | 0.0 /100 | #315 | Tragic 2.9% |
| Houma | 0.0 /100 | #316 | Tragic 2.9% |
| Immigrants | El Salvador | 0.0 /100 | #317 | Tragic 2.9% |
| Cape Verdeans | 0.0 /100 | #318 | Tragic 2.9% |
| Ute | 0.0 /100 | #319 | Tragic 3.0% |
| Guatemalans | 0.0 /100 | #320 | Tragic 3.0% |
| Mexicans | 0.0 /100 | #321 | Tragic 3.0% |
| Immigrants | Guatemala | 0.0 /100 | #322 | Tragic 3.0% |
| Immigrants | Central America | 0.0 /100 | #323 | Tragic 3.0% |
| Fijians | 0.0 /100 | #324 | Tragic 3.0% |
| Immigrants | Mexico | 0.0 /100 | #325 | Tragic 3.0% |
| Aleuts | 0.0 /100 | #326 | Tragic 3.0% |
Demographics Similar to Immigrants from Scotland by Single Father Households
In terms of single father households, the demographic groups most similar to Immigrants from Scotland are Immigrants from Sweden (2.1%, a difference of 0.010%), Immigrants from Saudi Arabia (2.1%, a difference of 0.030%), Immigrants from Bangladesh (2.1%, a difference of 0.30%), Immigrants from Egypt (2.1%, a difference of 0.30%), and Estonian (2.1%, a difference of 0.34%).
| Demographics | Rating | Rank | Single Father Households |
| Immigrants | Romania | 99.8 /100 | #69 | Exceptional 2.1% |
| Egyptians | 99.8 /100 | #70 | Exceptional 2.1% |
| Immigrants | Kuwait | 99.8 /100 | #71 | Exceptional 2.1% |
| Immigrants | Spain | 99.8 /100 | #72 | Exceptional 2.1% |
| Immigrants | Bangladesh | 99.8 /100 | #73 | Exceptional 2.1% |
| Immigrants | Egypt | 99.8 /100 | #74 | Exceptional 2.1% |
| Immigrants | Sweden | 99.8 /100 | #75 | Exceptional 2.1% |
| Immigrants | Scotland | 99.8 /100 | #76 | Exceptional 2.1% |
| Immigrants | Saudi Arabia | 99.8 /100 | #77 | Exceptional 2.1% |
| Estonians | 99.7 /100 | #78 | Exceptional 2.1% |
| Immigrants | Asia | 99.7 /100 | #79 | Exceptional 2.1% |
| Immigrants | South Africa | 99.7 /100 | #80 | Exceptional 2.1% |
| Armenians | 99.7 /100 | #81 | Exceptional 2.1% |
| New Zealanders | 99.7 /100 | #82 | Exceptional 2.1% |
| Greeks | 99.7 /100 | #83 | Exceptional 2.1% |