Ute vs French Single Father Households
COMPARE
Ute
French
Single Father Households
Single Father Households Comparison
Ute
French
3.0%
SINGLE FATHER HOUSEHOLDS
0.0/ 100
METRIC RATING
319th/ 347
METRIC RANK
2.4%
SINGLE FATHER HOUSEHOLDS
31.7/ 100
METRIC RATING
190th/ 347
METRIC RANK
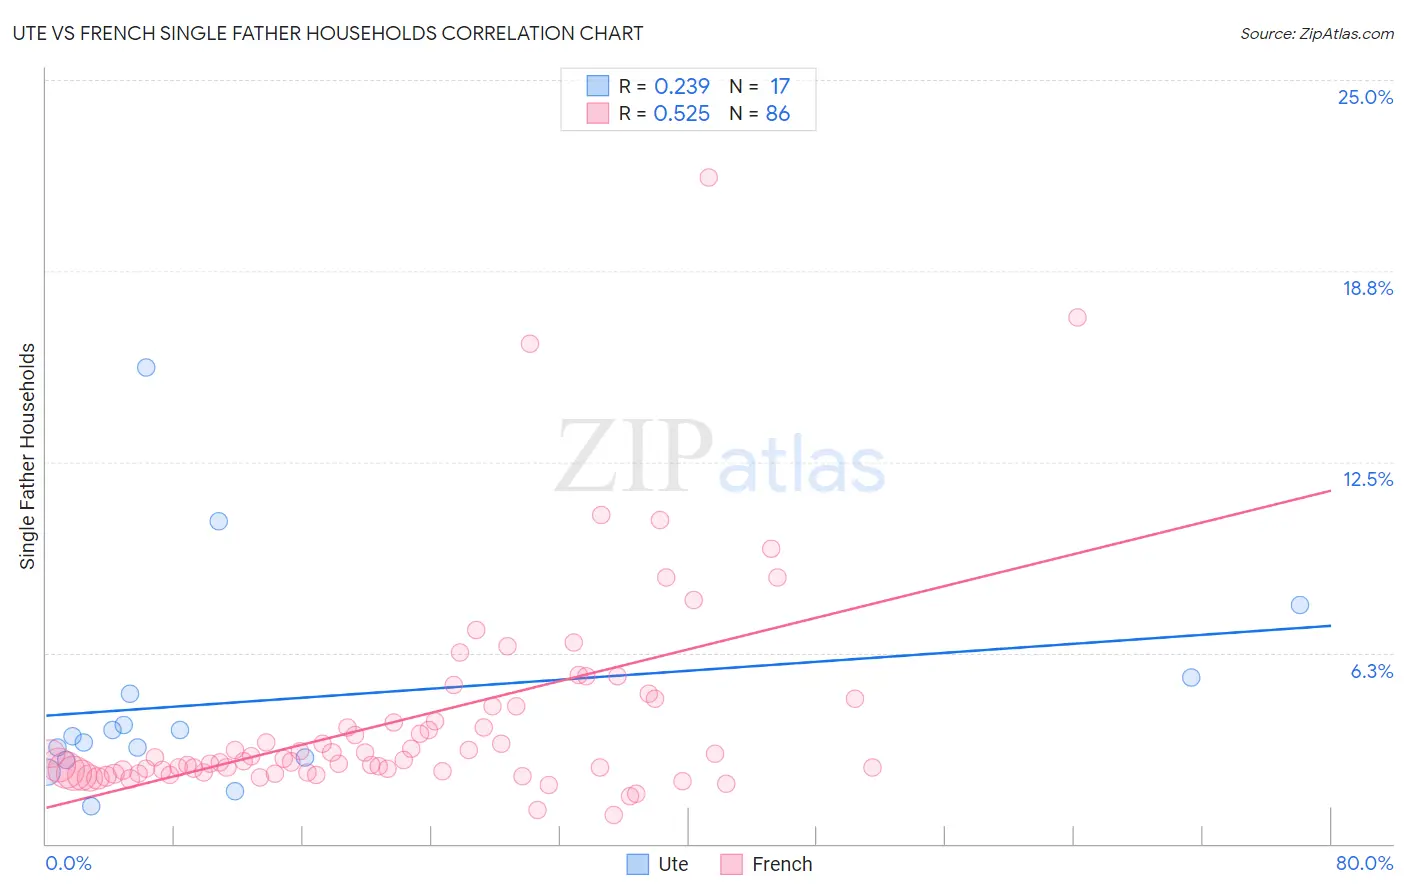
Ute vs French Single Father Households Correlation Chart
The statistical analysis conducted on geographies consisting of 55,604,261 people shows a weak positive correlation between the proportion of Ute and percentage of single father households in the United States with a correlation coefficient (R) of 0.239 and weighted average of 3.0%. Similarly, the statistical analysis conducted on geographies consisting of 557,216,183 people shows a substantial positive correlation between the proportion of French and percentage of single father households in the United States with a correlation coefficient (R) of 0.525 and weighted average of 2.4%, a difference of 24.9%.
Single Father Households Correlation Summary
| Measurement | Ute | French |
| Minimum | 1.2% | 0.93% |
| Maximum | 15.6% | 21.8% |
| Range | 14.4% | 20.9% |
| Mean | 4.7% | 4.1% |
| Median | 3.5% | 2.8% |
| Interquartile 25% (IQ1) | 2.8% | 2.3% |
| Interquartile 75% (IQ3) | 5.2% | 4.5% |
| Interquartile Range (IQR) | 2.4% | 2.2% |
| Standard Deviation (Sample) | 3.6% | 3.4% |
| Standard Deviation (Population) | 3.5% | 3.4% |
Similar Demographics by Single Father Households
Demographics Similar to Ute by Single Father Households
In terms of single father households, the demographic groups most similar to Ute are Guatemalan (3.0%, a difference of 0.080%), Mexican (3.0%, a difference of 0.47%), Cape Verdean (2.9%, a difference of 0.53%), Immigrants from El Salvador (2.9%, a difference of 0.54%), and Immigrants from Guatemala (3.0%, a difference of 1.0%).
| Demographics | Rating | Rank | Single Father Households |
| Tsimshian | 0.0 /100 | #312 | Tragic 2.9% |
| Arapaho | 0.0 /100 | #313 | Tragic 2.9% |
| Salvadorans | 0.0 /100 | #314 | Tragic 2.9% |
| Cheyenne | 0.0 /100 | #315 | Tragic 2.9% |
| Houma | 0.0 /100 | #316 | Tragic 2.9% |
| Immigrants | El Salvador | 0.0 /100 | #317 | Tragic 2.9% |
| Cape Verdeans | 0.0 /100 | #318 | Tragic 2.9% |
| Ute | 0.0 /100 | #319 | Tragic 3.0% |
| Guatemalans | 0.0 /100 | #320 | Tragic 3.0% |
| Mexicans | 0.0 /100 | #321 | Tragic 3.0% |
| Immigrants | Guatemala | 0.0 /100 | #322 | Tragic 3.0% |
| Immigrants | Central America | 0.0 /100 | #323 | Tragic 3.0% |
| Fijians | 0.0 /100 | #324 | Tragic 3.0% |
| Immigrants | Mexico | 0.0 /100 | #325 | Tragic 3.0% |
| Aleuts | 0.0 /100 | #326 | Tragic 3.0% |
Demographics Similar to French by Single Father Households
In terms of single father households, the demographic groups most similar to French are U.S. Virgin Islander (2.4%, a difference of 0.0%), Hmong (2.4%, a difference of 0.11%), Immigrants from Africa (2.4%, a difference of 0.15%), Immigrants from Sudan (2.4%, a difference of 0.16%), and Uruguayan (2.4%, a difference of 0.17%).
| Demographics | Rating | Rank | Single Father Households |
| Immigrants | Panama | 41.8 /100 | #183 | Average 2.4% |
| Sri Lankans | 41.8 /100 | #184 | Average 2.4% |
| Nigerians | 41.0 /100 | #185 | Average 2.4% |
| Immigrants | Bosnia and Herzegovina | 40.4 /100 | #186 | Average 2.4% |
| Immigrants | Colombia | 34.0 /100 | #187 | Fair 2.4% |
| Hmong | 33.0 /100 | #188 | Fair 2.4% |
| U.S. Virgin Islanders | 31.8 /100 | #189 | Fair 2.4% |
| French | 31.7 /100 | #190 | Fair 2.4% |
| Immigrants | Africa | 30.0 /100 | #191 | Fair 2.4% |
| Immigrants | Sudan | 29.8 /100 | #192 | Fair 2.4% |
| Uruguayans | 29.7 /100 | #193 | Fair 2.4% |
| Panamanians | 29.6 /100 | #194 | Fair 2.4% |
| Immigrants | Philippines | 28.7 /100 | #195 | Fair 2.4% |
| Kenyans | 28.0 /100 | #196 | Fair 2.4% |
| Germans | 28.0 /100 | #197 | Fair 2.4% |