Tohono O'odham vs Immigrants from Eastern Europe Currently Married
COMPARE
Tohono O'odham
Immigrants from Eastern Europe
Currently Married
Currently Married Comparison
Tohono O'odham
Immigrants from Eastern Europe
36.8%
CURRENTLY MARRIED
0.0/ 100
METRIC RATING
345th/ 347
METRIC RANK
48.0%
CURRENTLY MARRIED
96.1/ 100
METRIC RATING
88th/ 347
METRIC RANK
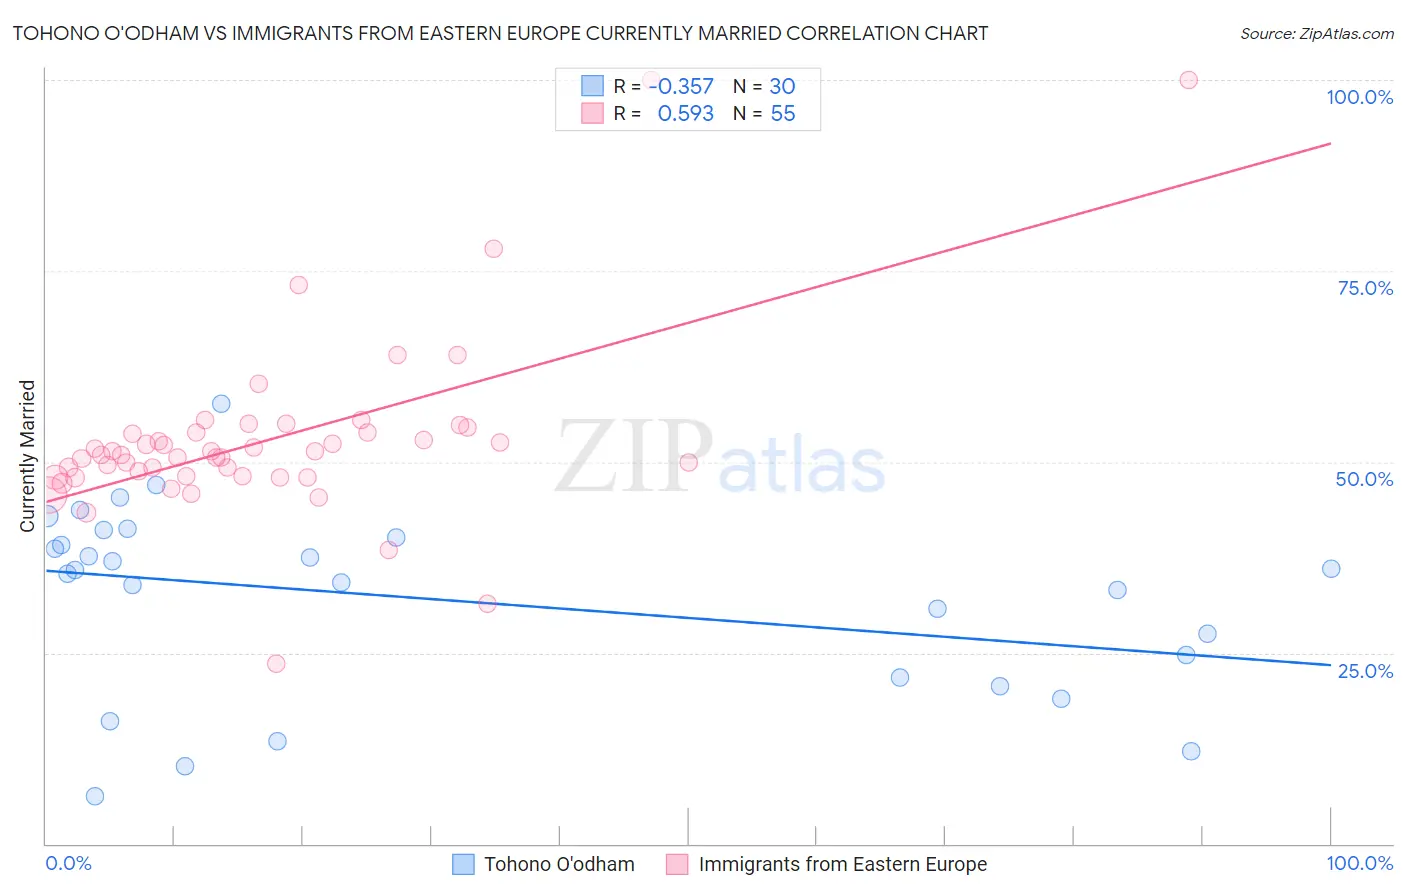
Tohono O'odham vs Immigrants from Eastern Europe Currently Married Correlation Chart
The statistical analysis conducted on geographies consisting of 58,730,067 people shows a mild negative correlation between the proportion of Tohono O'odham and percentage of population currently married in the United States with a correlation coefficient (R) of -0.357 and weighted average of 36.8%. Similarly, the statistical analysis conducted on geographies consisting of 475,818,716 people shows a substantial positive correlation between the proportion of Immigrants from Eastern Europe and percentage of population currently married in the United States with a correlation coefficient (R) of 0.593 and weighted average of 48.0%, a difference of 30.6%.
Currently Married Correlation Summary
| Measurement | Tohono O'odham | Immigrants from Eastern Europe |
| Minimum | 6.2% | 23.5% |
| Maximum | 57.6% | 100.0% |
| Range | 51.4% | 76.5% |
| Mean | 32.0% | 52.9% |
| Median | 35.6% | 50.9% |
| Interquartile 25% (IQ1) | 21.8% | 48.1% |
| Interquartile 75% (IQ3) | 40.1% | 53.9% |
| Interquartile Range (IQR) | 18.3% | 5.9% |
| Standard Deviation (Sample) | 12.3% | 12.1% |
| Standard Deviation (Population) | 12.1% | 12.0% |
Similar Demographics by Currently Married
Demographics Similar to Tohono O'odham by Currently Married
In terms of currently married, the demographic groups most similar to Tohono O'odham are Hopi (36.5%, a difference of 0.58%), Pima (35.9%, a difference of 2.4%), Immigrants from Cabo Verde (37.8%, a difference of 2.9%), Pueblo (38.2%, a difference of 4.0%), and Immigrants from Dominican Republic (38.9%, a difference of 5.9%).
| Demographics | Rating | Rank | Currently Married |
| Yup'ik | 0.0 /100 | #333 | Tragic 39.9% |
| Puerto Ricans | 0.0 /100 | #334 | Tragic 39.9% |
| Lumbee | 0.0 /100 | #335 | Tragic 39.8% |
| British West Indians | 0.0 /100 | #336 | Tragic 39.8% |
| Blacks/African Americans | 0.0 /100 | #337 | Tragic 39.6% |
| Cape Verdeans | 0.0 /100 | #338 | Tragic 39.6% |
| Dominicans | 0.0 /100 | #339 | Tragic 39.5% |
| Immigrants | Grenada | 0.0 /100 | #340 | Tragic 39.1% |
| Navajo | 0.0 /100 | #341 | Tragic 39.0% |
| Immigrants | Dominican Republic | 0.0 /100 | #342 | Tragic 38.9% |
| Pueblo | 0.0 /100 | #343 | Tragic 38.2% |
| Immigrants | Cabo Verde | 0.0 /100 | #344 | Tragic 37.8% |
| Tohono O'odham | 0.0 /100 | #345 | Tragic 36.8% |
| Hopi | 0.0 /100 | #346 | Tragic 36.5% |
| Pima | 0.0 /100 | #347 | Tragic 35.9% |
Demographics Similar to Immigrants from Eastern Europe by Currently Married
In terms of currently married, the demographic groups most similar to Immigrants from Eastern Europe are Jordanian (48.0%, a difference of 0.020%), Immigrants from Japan (48.0%, a difference of 0.030%), French Canadian (48.0%, a difference of 0.060%), Indian (Asian) (48.0%, a difference of 0.060%), and American (48.0%, a difference of 0.080%).
| Demographics | Rating | Rank | Currently Married |
| Immigrants | Sri Lanka | 96.9 /100 | #81 | Exceptional 48.1% |
| Immigrants | Europe | 96.9 /100 | #82 | Exceptional 48.1% |
| Bolivians | 96.9 /100 | #83 | Exceptional 48.1% |
| Immigrants | Israel | 96.9 /100 | #84 | Exceptional 48.1% |
| French Canadians | 96.3 /100 | #85 | Exceptional 48.0% |
| Immigrants | Japan | 96.2 /100 | #86 | Exceptional 48.0% |
| Jordanians | 96.2 /100 | #87 | Exceptional 48.0% |
| Immigrants | Eastern Europe | 96.1 /100 | #88 | Exceptional 48.0% |
| Indians (Asian) | 95.8 /100 | #89 | Exceptional 48.0% |
| Americans | 95.7 /100 | #90 | Exceptional 48.0% |
| Immigrants | Bolivia | 95.6 /100 | #91 | Exceptional 47.9% |
| Koreans | 95.4 /100 | #92 | Exceptional 47.9% |
| Lebanese | 95.1 /100 | #93 | Exceptional 47.9% |
| Native Hawaiians | 95.0 /100 | #94 | Exceptional 47.9% |
| Immigrants | Bulgaria | 94.8 /100 | #95 | Exceptional 47.9% |