Asian vs Immigrants from Eastern Europe Currently Married
COMPARE
Asian
Immigrants from Eastern Europe
Currently Married
Currently Married Comparison
Asians
Immigrants from Eastern Europe
48.4%
CURRENTLY MARRIED
98.5/ 100
METRIC RATING
62nd/ 347
METRIC RANK
48.0%
CURRENTLY MARRIED
96.1/ 100
METRIC RATING
88th/ 347
METRIC RANK
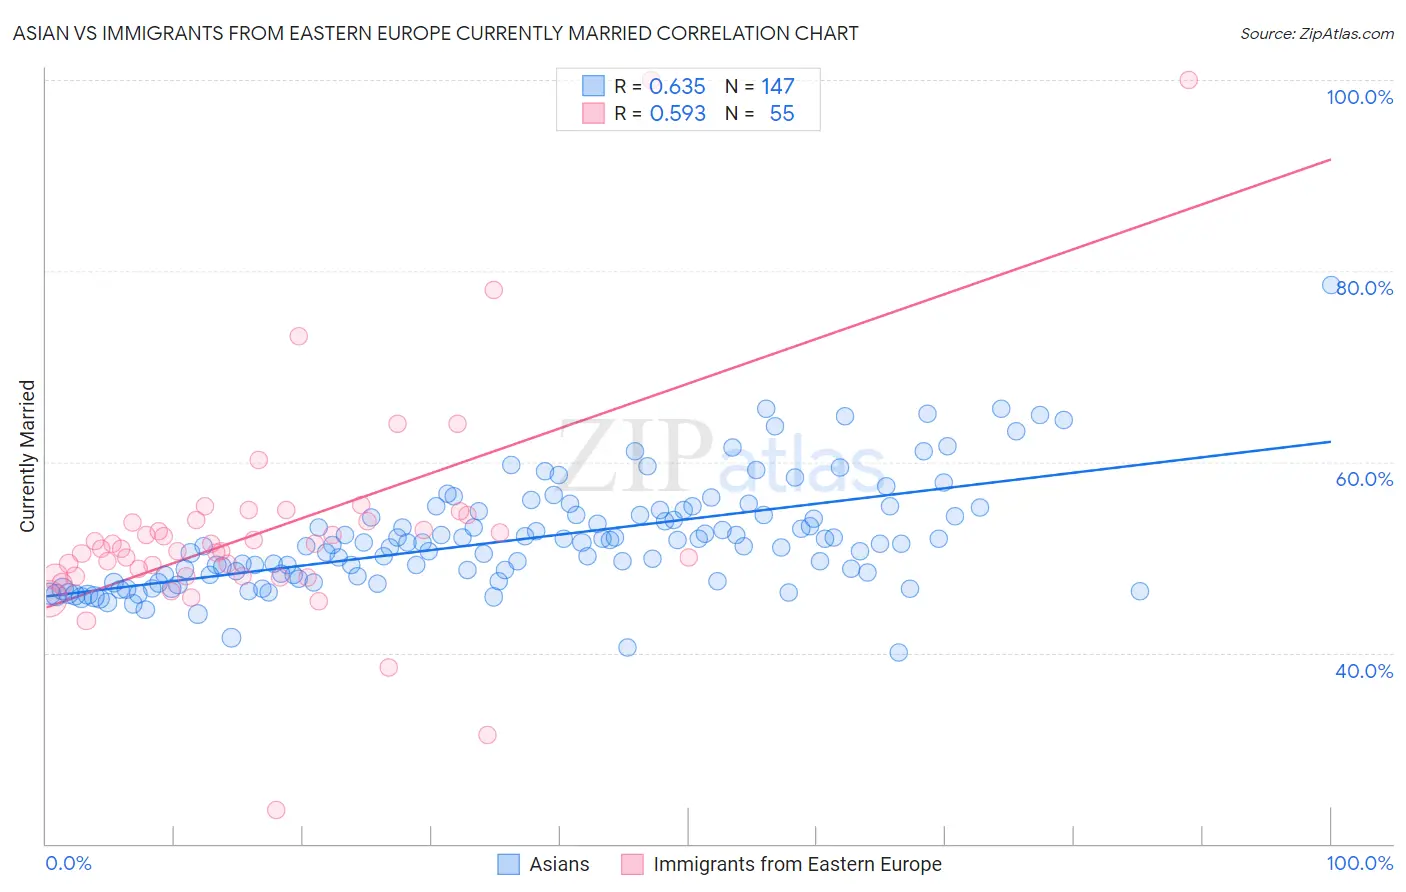
Asian vs Immigrants from Eastern Europe Currently Married Correlation Chart
The statistical analysis conducted on geographies consisting of 550,785,629 people shows a significant positive correlation between the proportion of Asians and percentage of population currently married in the United States with a correlation coefficient (R) of 0.635 and weighted average of 48.4%. Similarly, the statistical analysis conducted on geographies consisting of 475,818,716 people shows a substantial positive correlation between the proportion of Immigrants from Eastern Europe and percentage of population currently married in the United States with a correlation coefficient (R) of 0.593 and weighted average of 48.0%, a difference of 0.86%.
Currently Married Correlation Summary
| Measurement | Asian | Immigrants from Eastern Europe |
| Minimum | 40.0% | 23.5% |
| Maximum | 78.5% | 100.0% |
| Range | 38.5% | 76.5% |
| Mean | 51.9% | 52.9% |
| Median | 51.4% | 50.9% |
| Interquartile 25% (IQ1) | 48.1% | 48.1% |
| Interquartile 75% (IQ3) | 54.5% | 53.9% |
| Interquartile Range (IQR) | 6.4% | 5.9% |
| Standard Deviation (Sample) | 5.7% | 12.1% |
| Standard Deviation (Population) | 5.7% | 12.0% |
Similar Demographics by Currently Married
Demographics Similar to Asians by Currently Married
In terms of currently married, the demographic groups most similar to Asians are Romanian (48.4%, a difference of 0.0%), Immigrants from Romania (48.4%, a difference of 0.010%), Immigrants from Ireland (48.4%, a difference of 0.030%), French (48.4%, a difference of 0.060%), and Immigrants from Netherlands (48.5%, a difference of 0.10%).
| Demographics | Rating | Rank | Currently Married |
| Immigrants | North Macedonia | 98.7 /100 | #55 | Exceptional 48.5% |
| Latvians | 98.7 /100 | #56 | Exceptional 48.5% |
| Immigrants | Netherlands | 98.6 /100 | #57 | Exceptional 48.5% |
| French | 98.6 /100 | #58 | Exceptional 48.4% |
| Immigrants | Ireland | 98.5 /100 | #59 | Exceptional 48.4% |
| Immigrants | Romania | 98.5 /100 | #60 | Exceptional 48.4% |
| Romanians | 98.5 /100 | #61 | Exceptional 48.4% |
| Asians | 98.5 /100 | #62 | Exceptional 48.4% |
| Slavs | 98.3 /100 | #63 | Exceptional 48.4% |
| Immigrants | Czechoslovakia | 98.3 /100 | #64 | Exceptional 48.4% |
| Ukrainians | 98.3 /100 | #65 | Exceptional 48.4% |
| Tongans | 98.2 /100 | #66 | Exceptional 48.3% |
| Slovaks | 98.2 /100 | #67 | Exceptional 48.3% |
| Immigrants | England | 98.2 /100 | #68 | Exceptional 48.3% |
| Canadians | 98.1 /100 | #69 | Exceptional 48.3% |
Demographics Similar to Immigrants from Eastern Europe by Currently Married
In terms of currently married, the demographic groups most similar to Immigrants from Eastern Europe are Jordanian (48.0%, a difference of 0.020%), Immigrants from Japan (48.0%, a difference of 0.030%), French Canadian (48.0%, a difference of 0.060%), Indian (Asian) (48.0%, a difference of 0.060%), and American (48.0%, a difference of 0.080%).
| Demographics | Rating | Rank | Currently Married |
| Immigrants | Sri Lanka | 96.9 /100 | #81 | Exceptional 48.1% |
| Immigrants | Europe | 96.9 /100 | #82 | Exceptional 48.1% |
| Bolivians | 96.9 /100 | #83 | Exceptional 48.1% |
| Immigrants | Israel | 96.9 /100 | #84 | Exceptional 48.1% |
| French Canadians | 96.3 /100 | #85 | Exceptional 48.0% |
| Immigrants | Japan | 96.2 /100 | #86 | Exceptional 48.0% |
| Jordanians | 96.2 /100 | #87 | Exceptional 48.0% |
| Immigrants | Eastern Europe | 96.1 /100 | #88 | Exceptional 48.0% |
| Indians (Asian) | 95.8 /100 | #89 | Exceptional 48.0% |
| Americans | 95.7 /100 | #90 | Exceptional 48.0% |
| Immigrants | Bolivia | 95.6 /100 | #91 | Exceptional 47.9% |
| Koreans | 95.4 /100 | #92 | Exceptional 47.9% |
| Lebanese | 95.1 /100 | #93 | Exceptional 47.9% |
| Native Hawaiians | 95.0 /100 | #94 | Exceptional 47.9% |
| Immigrants | Bulgaria | 94.8 /100 | #95 | Exceptional 47.9% |