Immigrants from St. Vincent and the Grenadines vs Immigrants from Eastern Europe Currently Married
COMPARE
Immigrants from St. Vincent and the Grenadines
Immigrants from Eastern Europe
Currently Married
Currently Married Comparison
Immigrants from St. Vincent and the Grenadines
Immigrants from Eastern Europe
40.1%
CURRENTLY MARRIED
0.0/ 100
METRIC RATING
332nd/ 347
METRIC RANK
48.0%
CURRENTLY MARRIED
96.1/ 100
METRIC RATING
88th/ 347
METRIC RANK
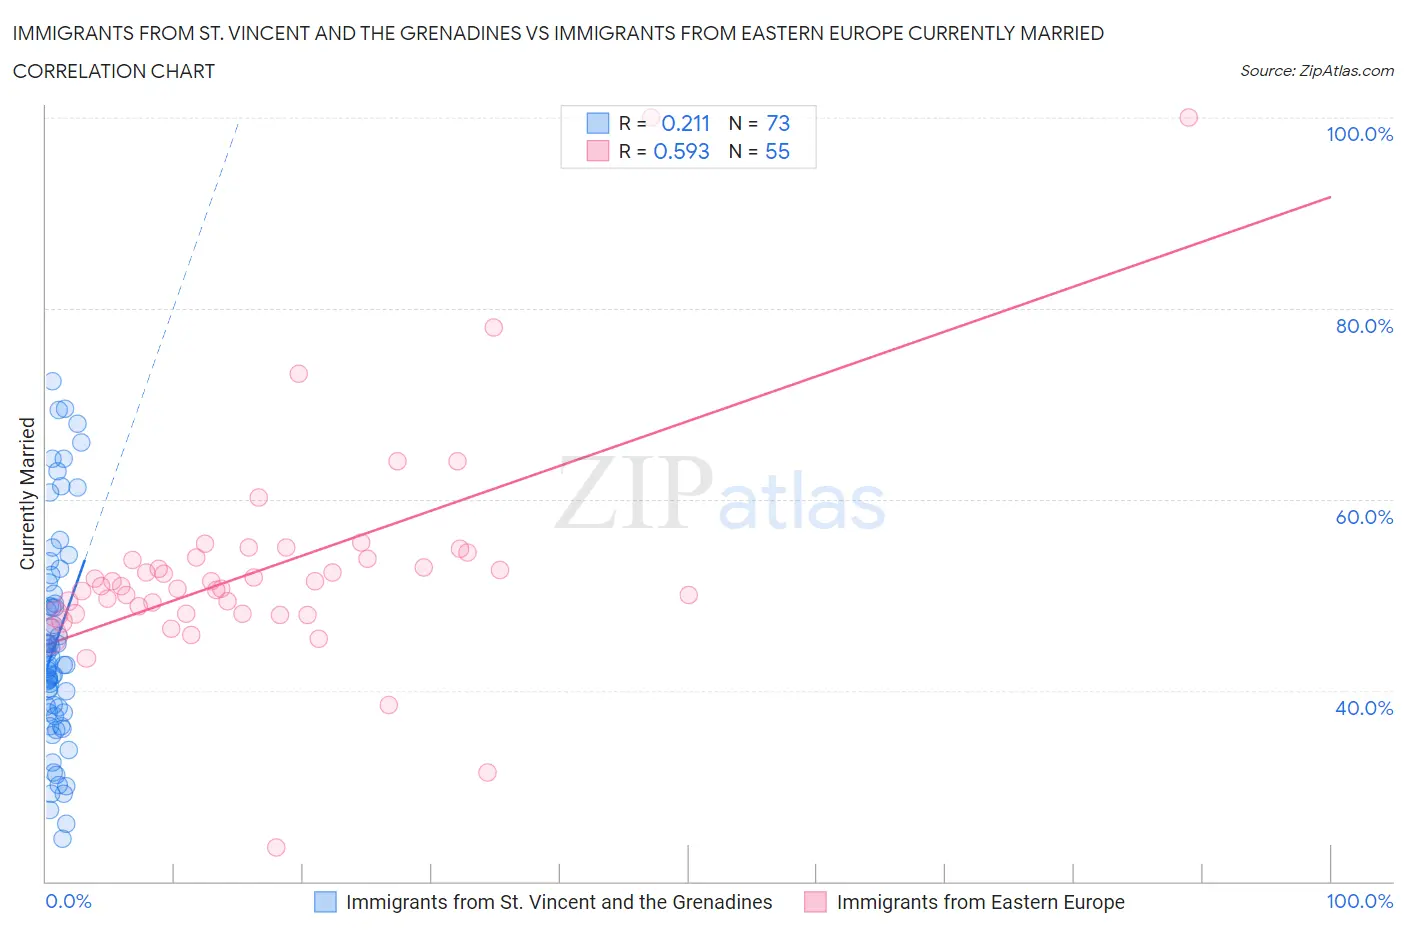
Immigrants from St. Vincent and the Grenadines vs Immigrants from Eastern Europe Currently Married Correlation Chart
The statistical analysis conducted on geographies consisting of 56,191,418 people shows a weak positive correlation between the proportion of Immigrants from St. Vincent and the Grenadines and percentage of population currently married in the United States with a correlation coefficient (R) of 0.211 and weighted average of 40.1%. Similarly, the statistical analysis conducted on geographies consisting of 475,818,716 people shows a substantial positive correlation between the proportion of Immigrants from Eastern Europe and percentage of population currently married in the United States with a correlation coefficient (R) of 0.593 and weighted average of 48.0%, a difference of 19.8%.
Currently Married Correlation Summary
| Measurement | Immigrants from St. Vincent and the Grenadines | Immigrants from Eastern Europe |
| Minimum | 24.4% | 23.5% |
| Maximum | 72.4% | 100.0% |
| Range | 48.0% | 76.5% |
| Mean | 44.9% | 52.9% |
| Median | 42.7% | 50.9% |
| Interquartile 25% (IQ1) | 37.7% | 48.1% |
| Interquartile 75% (IQ3) | 50.7% | 53.9% |
| Interquartile Range (IQR) | 13.0% | 5.9% |
| Standard Deviation (Sample) | 11.2% | 12.1% |
| Standard Deviation (Population) | 11.1% | 12.0% |
Similar Demographics by Currently Married
Demographics Similar to Immigrants from St. Vincent and the Grenadines by Currently Married
In terms of currently married, the demographic groups most similar to Immigrants from St. Vincent and the Grenadines are Yup'ik (39.9%, a difference of 0.39%), Puerto Rican (39.9%, a difference of 0.41%), Lumbee (39.8%, a difference of 0.57%), Immigrants from Barbados (40.3%, a difference of 0.67%), and Immigrants from Dominica (40.3%, a difference of 0.69%).
| Demographics | Rating | Rank | Currently Married |
| U.S. Virgin Islanders | 0.0 /100 | #325 | Tragic 40.7% |
| Barbadians | 0.0 /100 | #326 | Tragic 40.6% |
| Senegalese | 0.0 /100 | #327 | Tragic 40.6% |
| Arapaho | 0.0 /100 | #328 | Tragic 40.5% |
| Crow | 0.0 /100 | #329 | Tragic 40.4% |
| Immigrants | Dominica | 0.0 /100 | #330 | Tragic 40.3% |
| Immigrants | Barbados | 0.0 /100 | #331 | Tragic 40.3% |
| Immigrants | St. Vincent and the Grenadines | 0.0 /100 | #332 | Tragic 40.1% |
| Yup'ik | 0.0 /100 | #333 | Tragic 39.9% |
| Puerto Ricans | 0.0 /100 | #334 | Tragic 39.9% |
| Lumbee | 0.0 /100 | #335 | Tragic 39.8% |
| British West Indians | 0.0 /100 | #336 | Tragic 39.8% |
| Blacks/African Americans | 0.0 /100 | #337 | Tragic 39.6% |
| Cape Verdeans | 0.0 /100 | #338 | Tragic 39.6% |
| Dominicans | 0.0 /100 | #339 | Tragic 39.5% |
Demographics Similar to Immigrants from Eastern Europe by Currently Married
In terms of currently married, the demographic groups most similar to Immigrants from Eastern Europe are Jordanian (48.0%, a difference of 0.020%), Immigrants from Japan (48.0%, a difference of 0.030%), French Canadian (48.0%, a difference of 0.060%), Indian (Asian) (48.0%, a difference of 0.060%), and American (48.0%, a difference of 0.080%).
| Demographics | Rating | Rank | Currently Married |
| Immigrants | Sri Lanka | 96.9 /100 | #81 | Exceptional 48.1% |
| Immigrants | Europe | 96.9 /100 | #82 | Exceptional 48.1% |
| Bolivians | 96.9 /100 | #83 | Exceptional 48.1% |
| Immigrants | Israel | 96.9 /100 | #84 | Exceptional 48.1% |
| French Canadians | 96.3 /100 | #85 | Exceptional 48.0% |
| Immigrants | Japan | 96.2 /100 | #86 | Exceptional 48.0% |
| Jordanians | 96.2 /100 | #87 | Exceptional 48.0% |
| Immigrants | Eastern Europe | 96.1 /100 | #88 | Exceptional 48.0% |
| Indians (Asian) | 95.8 /100 | #89 | Exceptional 48.0% |
| Americans | 95.7 /100 | #90 | Exceptional 48.0% |
| Immigrants | Bolivia | 95.6 /100 | #91 | Exceptional 47.9% |
| Koreans | 95.4 /100 | #92 | Exceptional 47.9% |
| Lebanese | 95.1 /100 | #93 | Exceptional 47.9% |
| Native Hawaiians | 95.0 /100 | #94 | Exceptional 47.9% |
| Immigrants | Bulgaria | 94.8 /100 | #95 | Exceptional 47.9% |