Ukrainian vs Guamanian/Chamorro Family Households with Children
COMPARE
Ukrainian
Guamanian/Chamorro
Family Households with Children
Family Households with Children Comparison
Ukrainians
Guamanians/Chamorros
26.9%
FAMILY HOUSEHOLDS WITH CHILDREN
2.9/ 100
METRIC RATING
244th/ 347
METRIC RANK
29.7%
FAMILY HOUSEHOLDS WITH CHILDREN
100.0/ 100
METRIC RATING
24th/ 347
METRIC RANK
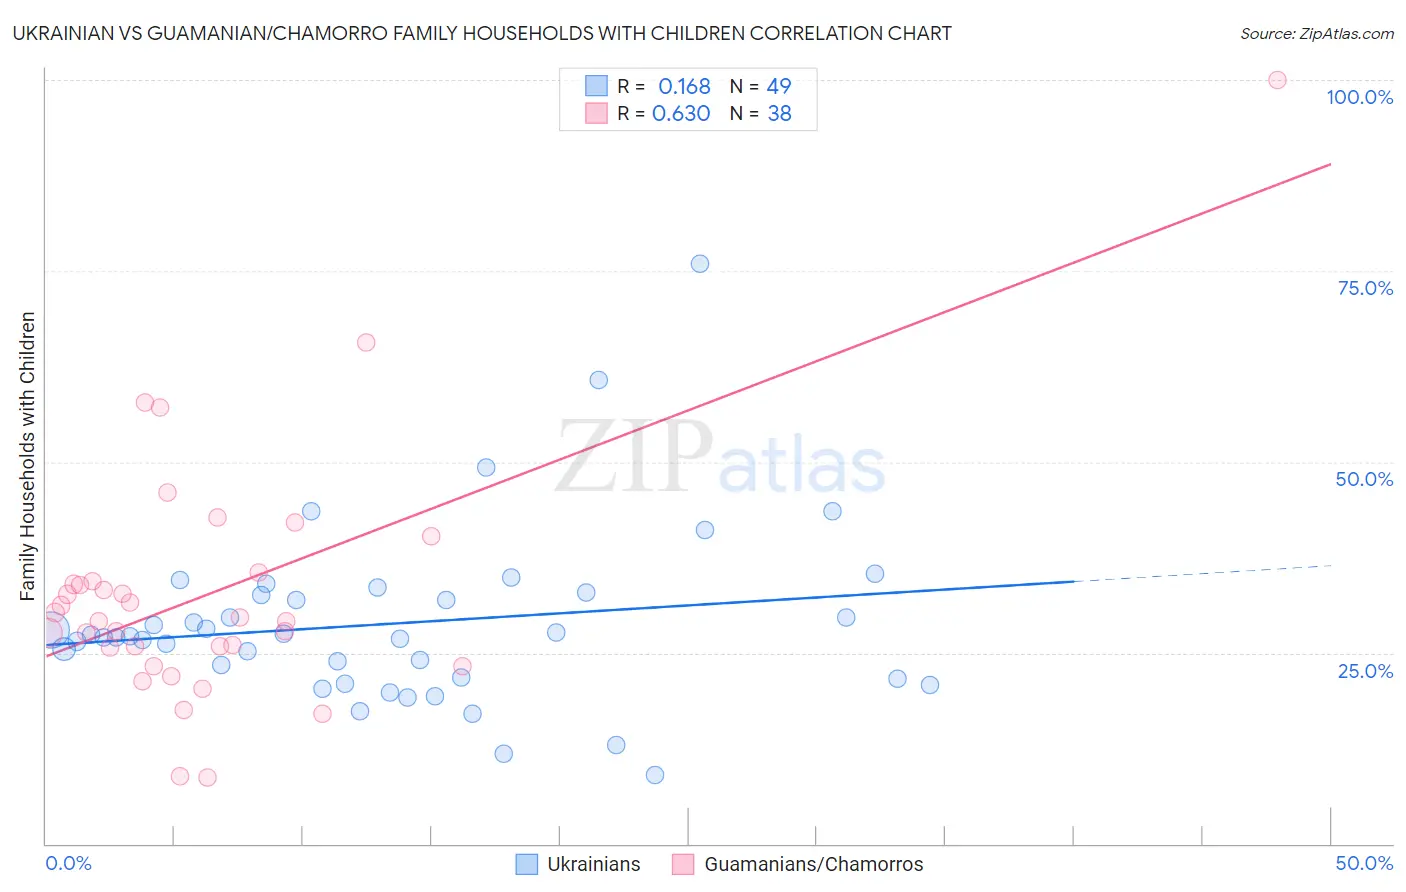
Ukrainian vs Guamanian/Chamorro Family Households with Children Correlation Chart
The statistical analysis conducted on geographies consisting of 448,081,438 people shows a poor positive correlation between the proportion of Ukrainians and percentage of family households with children in the United States with a correlation coefficient (R) of 0.168 and weighted average of 26.9%. Similarly, the statistical analysis conducted on geographies consisting of 221,827,817 people shows a significant positive correlation between the proportion of Guamanians/Chamorros and percentage of family households with children in the United States with a correlation coefficient (R) of 0.630 and weighted average of 29.7%, a difference of 10.4%.
Family Households with Children Correlation Summary
| Measurement | Ukrainian | Guamanian/Chamorro |
| Minimum | 9.0% | 8.6% |
| Maximum | 75.9% | 100.0% |
| Range | 66.8% | 91.4% |
| Mean | 28.8% | 32.8% |
| Median | 27.1% | 29.4% |
| Interquartile 25% (IQ1) | 21.7% | 25.8% |
| Interquartile 75% (IQ3) | 32.7% | 34.4% |
| Interquartile Range (IQR) | 11.1% | 8.7% |
| Standard Deviation (Sample) | 11.5% | 16.3% |
| Standard Deviation (Population) | 11.4% | 16.1% |
Similar Demographics by Family Households with Children
Demographics Similar to Ukrainians by Family Households with Children
In terms of family households with children, the demographic groups most similar to Ukrainians are Immigrants from Saudi Arabia (26.9%, a difference of 0.010%), Australian (26.9%, a difference of 0.020%), Navajo (26.9%, a difference of 0.070%), Immigrants from England (26.9%, a difference of 0.070%), and Immigrants from Bulgaria (26.9%, a difference of 0.080%).
| Demographics | Rating | Rank | Family Households with Children |
| Immigrants | Netherlands | 3.5 /100 | #237 | Tragic 26.9% |
| Moroccans | 3.4 /100 | #238 | Tragic 26.9% |
| Immigrants | Southern Europe | 3.4 /100 | #239 | Tragic 26.9% |
| Immigrants | Bulgaria | 3.3 /100 | #240 | Tragic 26.9% |
| Navajo | 3.2 /100 | #241 | Tragic 26.9% |
| Immigrants | England | 3.2 /100 | #242 | Tragic 26.9% |
| Immigrants | Saudi Arabia | 2.9 /100 | #243 | Tragic 26.9% |
| Ukrainians | 2.9 /100 | #244 | Tragic 26.9% |
| Australians | 2.8 /100 | #245 | Tragic 26.9% |
| Jamaicans | 2.5 /100 | #246 | Tragic 26.9% |
| Potawatomi | 2.2 /100 | #247 | Tragic 26.9% |
| Immigrants | Kazakhstan | 2.2 /100 | #248 | Tragic 26.9% |
| Immigrants | Eastern Europe | 2.1 /100 | #249 | Tragic 26.9% |
| Belgians | 2.1 /100 | #250 | Tragic 26.9% |
| Immigrants | Bosnia and Herzegovina | 1.9 /100 | #251 | Tragic 26.8% |
Demographics Similar to Guamanians/Chamorros by Family Households with Children
In terms of family households with children, the demographic groups most similar to Guamanians/Chamorros are Mexican American Indian (29.7%, a difference of 0.10%), Immigrants from Latin America (29.7%, a difference of 0.10%), Malaysian (29.8%, a difference of 0.37%), Immigrants from Laos (29.8%, a difference of 0.41%), and Immigrants from El Salvador (29.8%, a difference of 0.45%).
| Demographics | Rating | Rank | Family Households with Children |
| Hispanics or Latinos | 100.0 /100 | #17 | Exceptional 29.9% |
| Salvadorans | 100.0 /100 | #18 | Exceptional 29.9% |
| Alaska Natives | 100.0 /100 | #19 | Exceptional 29.9% |
| Immigrants | El Salvador | 100.0 /100 | #20 | Exceptional 29.8% |
| Immigrants | Laos | 100.0 /100 | #21 | Exceptional 29.8% |
| Malaysians | 100.0 /100 | #22 | Exceptional 29.8% |
| Mexican American Indians | 100.0 /100 | #23 | Exceptional 29.7% |
| Guamanians/Chamorros | 100.0 /100 | #24 | Exceptional 29.7% |
| Immigrants | Latin America | 100.0 /100 | #25 | Exceptional 29.7% |
| Sri Lankans | 100.0 /100 | #26 | Exceptional 29.5% |
| Immigrants | Vietnam | 100.0 /100 | #27 | Exceptional 29.5% |
| Samoans | 100.0 /100 | #28 | Exceptional 29.5% |
| Bolivians | 100.0 /100 | #29 | Exceptional 29.5% |
| Yuman | 100.0 /100 | #30 | Exceptional 29.5% |
| Japanese | 100.0 /100 | #31 | Exceptional 29.4% |