Ukrainian vs Immigrants from Germany Family Households with Children
COMPARE
Ukrainian
Immigrants from Germany
Family Households with Children
Family Households with Children Comparison
Ukrainians
Immigrants from Germany
26.9%
FAMILY HOUSEHOLDS WITH CHILDREN
2.9/ 100
METRIC RATING
244th/ 347
METRIC RANK
27.0%
FAMILY HOUSEHOLDS WITH CHILDREN
4.4/ 100
METRIC RATING
234th/ 347
METRIC RANK
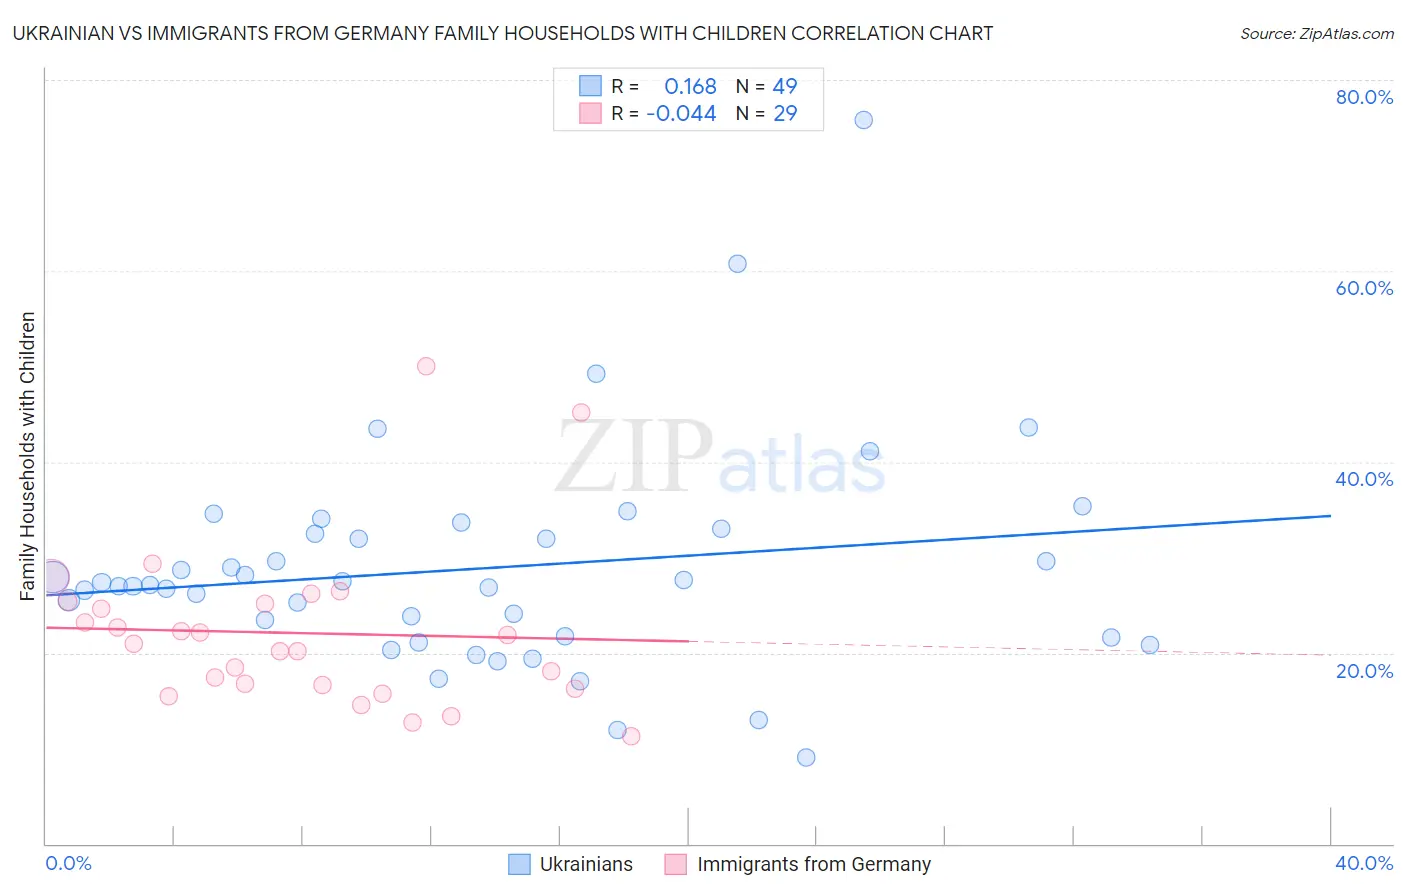
Ukrainian vs Immigrants from Germany Family Households with Children Correlation Chart
The statistical analysis conducted on geographies consisting of 448,081,438 people shows a poor positive correlation between the proportion of Ukrainians and percentage of family households with children in the United States with a correlation coefficient (R) of 0.168 and weighted average of 26.9%. Similarly, the statistical analysis conducted on geographies consisting of 463,563,782 people shows no correlation between the proportion of Immigrants from Germany and percentage of family households with children in the United States with a correlation coefficient (R) of -0.044 and weighted average of 27.0%, a difference of 0.26%.
Family Households with Children Correlation Summary
| Measurement | Ukrainian | Immigrants from Germany |
| Minimum | 9.0% | 11.3% |
| Maximum | 75.9% | 50.0% |
| Range | 66.8% | 38.7% |
| Mean | 28.8% | 22.1% |
| Median | 27.1% | 21.0% |
| Interquartile 25% (IQ1) | 21.7% | 16.5% |
| Interquartile 75% (IQ3) | 32.7% | 25.3% |
| Interquartile Range (IQR) | 11.1% | 8.8% |
| Standard Deviation (Sample) | 11.5% | 8.5% |
| Standard Deviation (Population) | 11.4% | 8.4% |
Demographics Similar to Ukrainians and Immigrants from Germany by Family Households with Children
In terms of family households with children, the demographic groups most similar to Ukrainians are Immigrants from Saudi Arabia (26.9%, a difference of 0.010%), Australian (26.9%, a difference of 0.020%), Navajo (26.9%, a difference of 0.070%), Immigrants from England (26.9%, a difference of 0.070%), and Immigrants from Bulgaria (26.9%, a difference of 0.080%). Similarly, the demographic groups most similar to Immigrants from Germany are Immigrants from Morocco (27.0%, a difference of 0.040%), Yugoslavian (27.0%, a difference of 0.080%), Immigrants from Italy (27.0%, a difference of 0.080%), Luxembourger (27.0%, a difference of 0.13%), and Cape Verdean (26.9%, a difference of 0.13%).
| Demographics | Rating | Rank | Family Households with Children |
| Immigrants | Caribbean | 6.3 /100 | #229 | Tragic 27.0% |
| Bulgarians | 5.8 /100 | #230 | Tragic 27.0% |
| Luxembourgers | 5.5 /100 | #231 | Tragic 27.0% |
| Yugoslavians | 5.1 /100 | #232 | Tragic 27.0% |
| Immigrants | Italy | 5.0 /100 | #233 | Tragic 27.0% |
| Immigrants | Germany | 4.4 /100 | #234 | Tragic 27.0% |
| Immigrants | Morocco | 4.2 /100 | #235 | Tragic 27.0% |
| Cape Verdeans | 3.6 /100 | #236 | Tragic 26.9% |
| Immigrants | Netherlands | 3.5 /100 | #237 | Tragic 26.9% |
| Moroccans | 3.4 /100 | #238 | Tragic 26.9% |
| Immigrants | Southern Europe | 3.4 /100 | #239 | Tragic 26.9% |
| Immigrants | Bulgaria | 3.3 /100 | #240 | Tragic 26.9% |
| Navajo | 3.2 /100 | #241 | Tragic 26.9% |
| Immigrants | England | 3.2 /100 | #242 | Tragic 26.9% |
| Immigrants | Saudi Arabia | 2.9 /100 | #243 | Tragic 26.9% |
| Ukrainians | 2.9 /100 | #244 | Tragic 26.9% |
| Australians | 2.8 /100 | #245 | Tragic 26.9% |
| Jamaicans | 2.5 /100 | #246 | Tragic 26.9% |
| Potawatomi | 2.2 /100 | #247 | Tragic 26.9% |
| Immigrants | Kazakhstan | 2.2 /100 | #248 | Tragic 26.9% |
| Immigrants | Eastern Europe | 2.1 /100 | #249 | Tragic 26.9% |