Ugandan vs Pima Divorced or Separated
COMPARE
Ugandan
Pima
Divorced or Separated
Divorced or Separated Comparison
Ugandans
Pima
11.8%
DIVORCED OR SEPARATED
93.1/ 100
METRIC RATING
124th/ 347
METRIC RANK
12.9%
DIVORCED OR SEPARATED
0.0/ 100
METRIC RATING
290th/ 347
METRIC RANK
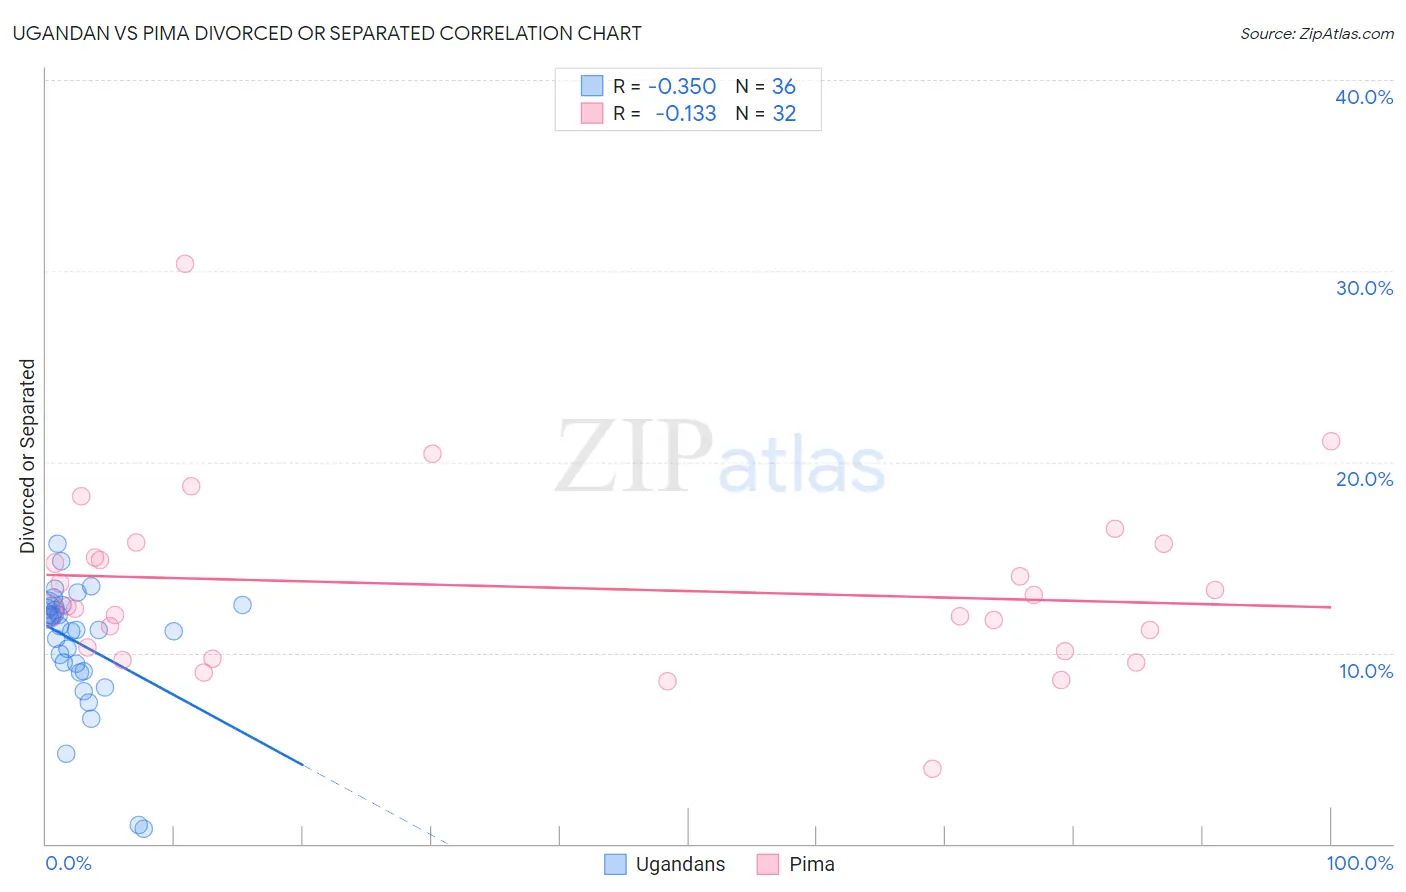
Ugandan vs Pima Divorced or Separated Correlation Chart
The statistical analysis conducted on geographies consisting of 94,013,976 people shows a mild negative correlation between the proportion of Ugandans and percentage of population currently divorced or separated in the United States with a correlation coefficient (R) of -0.350 and weighted average of 11.8%. Similarly, the statistical analysis conducted on geographies consisting of 61,551,758 people shows a poor negative correlation between the proportion of Pima and percentage of population currently divorced or separated in the United States with a correlation coefficient (R) of -0.133 and weighted average of 12.9%, a difference of 9.3%.
Divorced or Separated Correlation Summary
| Measurement | Ugandan | Pima |
| Minimum | 0.80% | 3.9% |
| Maximum | 15.7% | 30.4% |
| Range | 14.9% | 26.5% |
| Mean | 10.5% | 13.4% |
| Median | 11.3% | 12.4% |
| Interquartile 25% (IQ1) | 9.2% | 10.2% |
| Interquartile 75% (IQ3) | 12.4% | 15.4% |
| Interquartile Range (IQR) | 3.1% | 5.2% |
| Standard Deviation (Sample) | 3.3% | 4.8% |
| Standard Deviation (Population) | 3.2% | 4.7% |
Similar Demographics by Divorced or Separated
Demographics Similar to Ugandans by Divorced or Separated
In terms of divorced or separated, the demographic groups most similar to Ugandans are Immigrants (11.8%, a difference of 0.080%), Menominee (11.8%, a difference of 0.090%), Ukrainian (11.8%, a difference of 0.11%), South American Indian (11.8%, a difference of 0.13%), and Romanian (11.8%, a difference of 0.21%).
| Demographics | Rating | Rank | Divorced or Separated |
| Immigrants | Uganda | 95.3 /100 | #117 | Exceptional 11.7% |
| Ecuadorians | 95.3 /100 | #118 | Exceptional 11.7% |
| Syrians | 95.1 /100 | #119 | Exceptional 11.7% |
| Iraqis | 94.6 /100 | #120 | Exceptional 11.8% |
| Romanians | 94.5 /100 | #121 | Exceptional 11.8% |
| Menominee | 93.8 /100 | #122 | Exceptional 11.8% |
| Immigrants | Immigrants | 93.7 /100 | #123 | Exceptional 11.8% |
| Ugandans | 93.1 /100 | #124 | Exceptional 11.8% |
| Ukrainians | 92.3 /100 | #125 | Exceptional 11.8% |
| South American Indians | 92.1 /100 | #126 | Exceptional 11.8% |
| South Africans | 88.9 /100 | #127 | Excellent 11.8% |
| Immigrants | Ecuador | 88.9 /100 | #128 | Excellent 11.8% |
| Immigrants | St. Vincent and the Grenadines | 88.4 /100 | #129 | Excellent 11.8% |
| Immigrants | Austria | 88.2 /100 | #130 | Excellent 11.8% |
| Immigrants | Cambodia | 88.2 /100 | #131 | Excellent 11.8% |
Demographics Similar to Pima by Divorced or Separated
In terms of divorced or separated, the demographic groups most similar to Pima are Immigrants from Honduras (12.9%, a difference of 0.12%), Iroquois (12.9%, a difference of 0.14%), Scotch-Irish (12.9%, a difference of 0.17%), French Canadian (12.8%, a difference of 0.29%), and Jamaican (12.9%, a difference of 0.38%).
| Demographics | Rating | Rank | Divorced or Separated |
| Delaware | 0.1 /100 | #283 | Tragic 12.7% |
| Immigrants | Nonimmigrants | 0.1 /100 | #284 | Tragic 12.8% |
| French | 0.1 /100 | #285 | Tragic 12.8% |
| Spanish | 0.1 /100 | #286 | Tragic 12.8% |
| Hondurans | 0.1 /100 | #287 | Tragic 12.8% |
| French Canadians | 0.1 /100 | #288 | Tragic 12.8% |
| Iroquois | 0.0 /100 | #289 | Tragic 12.9% |
| Pima | 0.0 /100 | #290 | Tragic 12.9% |
| Immigrants | Honduras | 0.0 /100 | #291 | Tragic 12.9% |
| Scotch-Irish | 0.0 /100 | #292 | Tragic 12.9% |
| Jamaicans | 0.0 /100 | #293 | Tragic 12.9% |
| Apache | 0.0 /100 | #294 | Tragic 12.9% |
| Celtics | 0.0 /100 | #295 | Tragic 13.0% |
| Nicaraguans | 0.0 /100 | #296 | Tragic 13.0% |
| Natives/Alaskans | 0.0 /100 | #297 | Tragic 13.0% |